
IN REVIEW YEAR
2023
MISSION
Providing Energy. Improving Lives. VALUES Safety. Honor. Commitment.
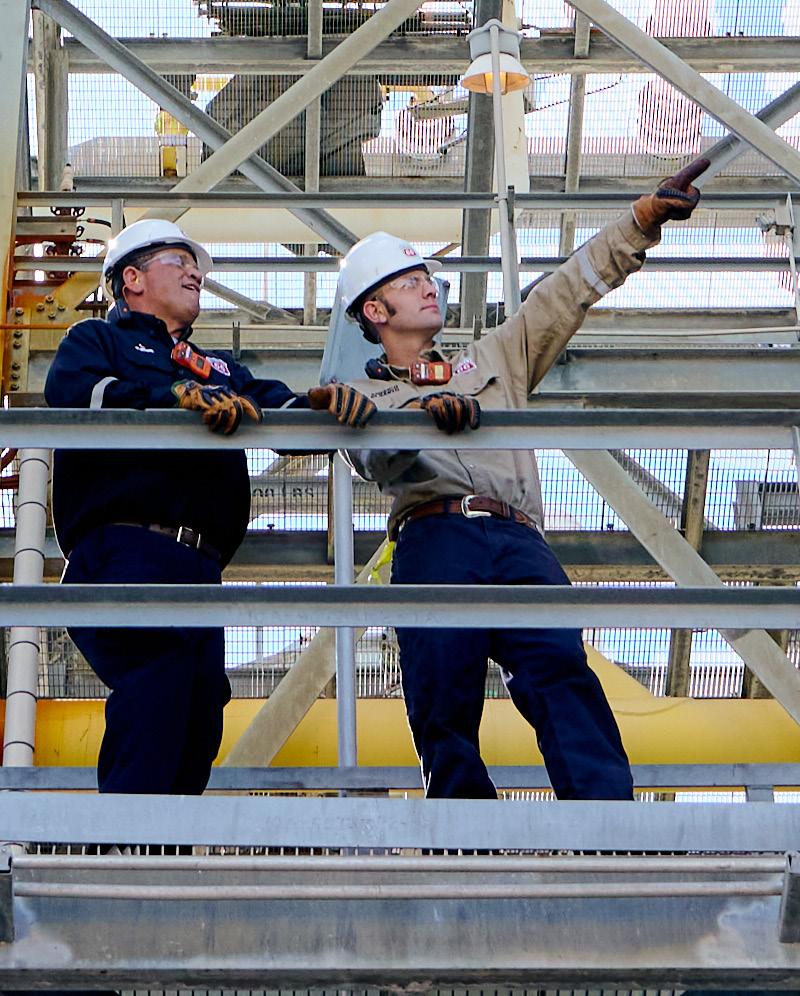
OUR ENERGY IN ACTION
We embrace our values as a common bond.
Work for the greater good.
Living our values earns us the confidence of our business partners, communities and coworkers.
We depend on each other to do our jobs.
Create an environment of trust.
Trusting each other makes us more productive and agile.
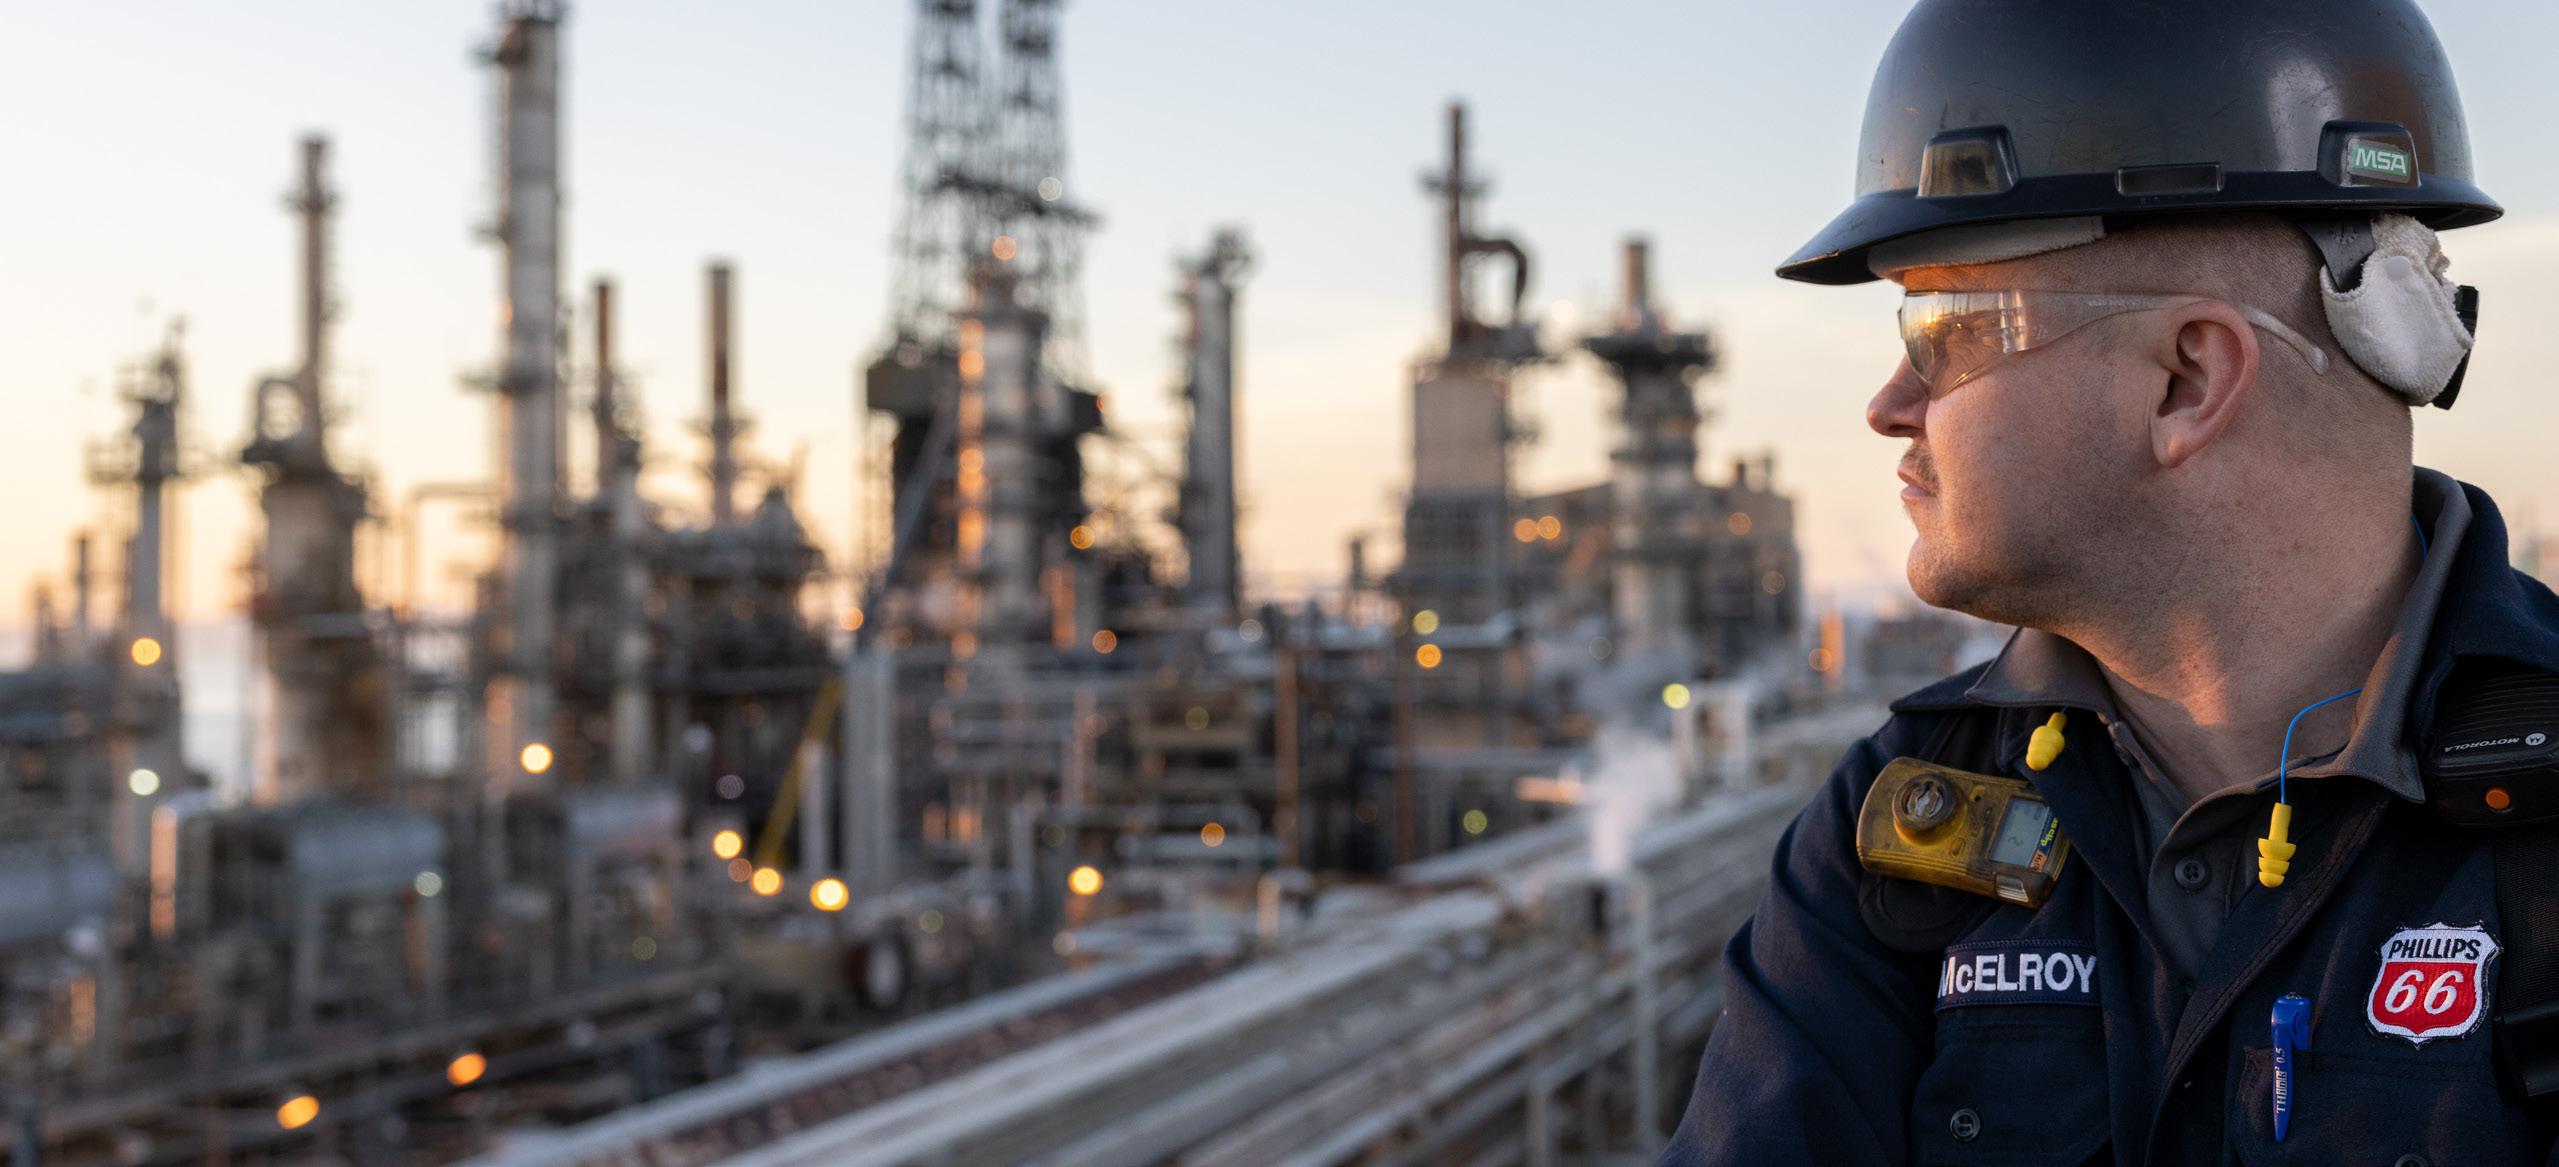
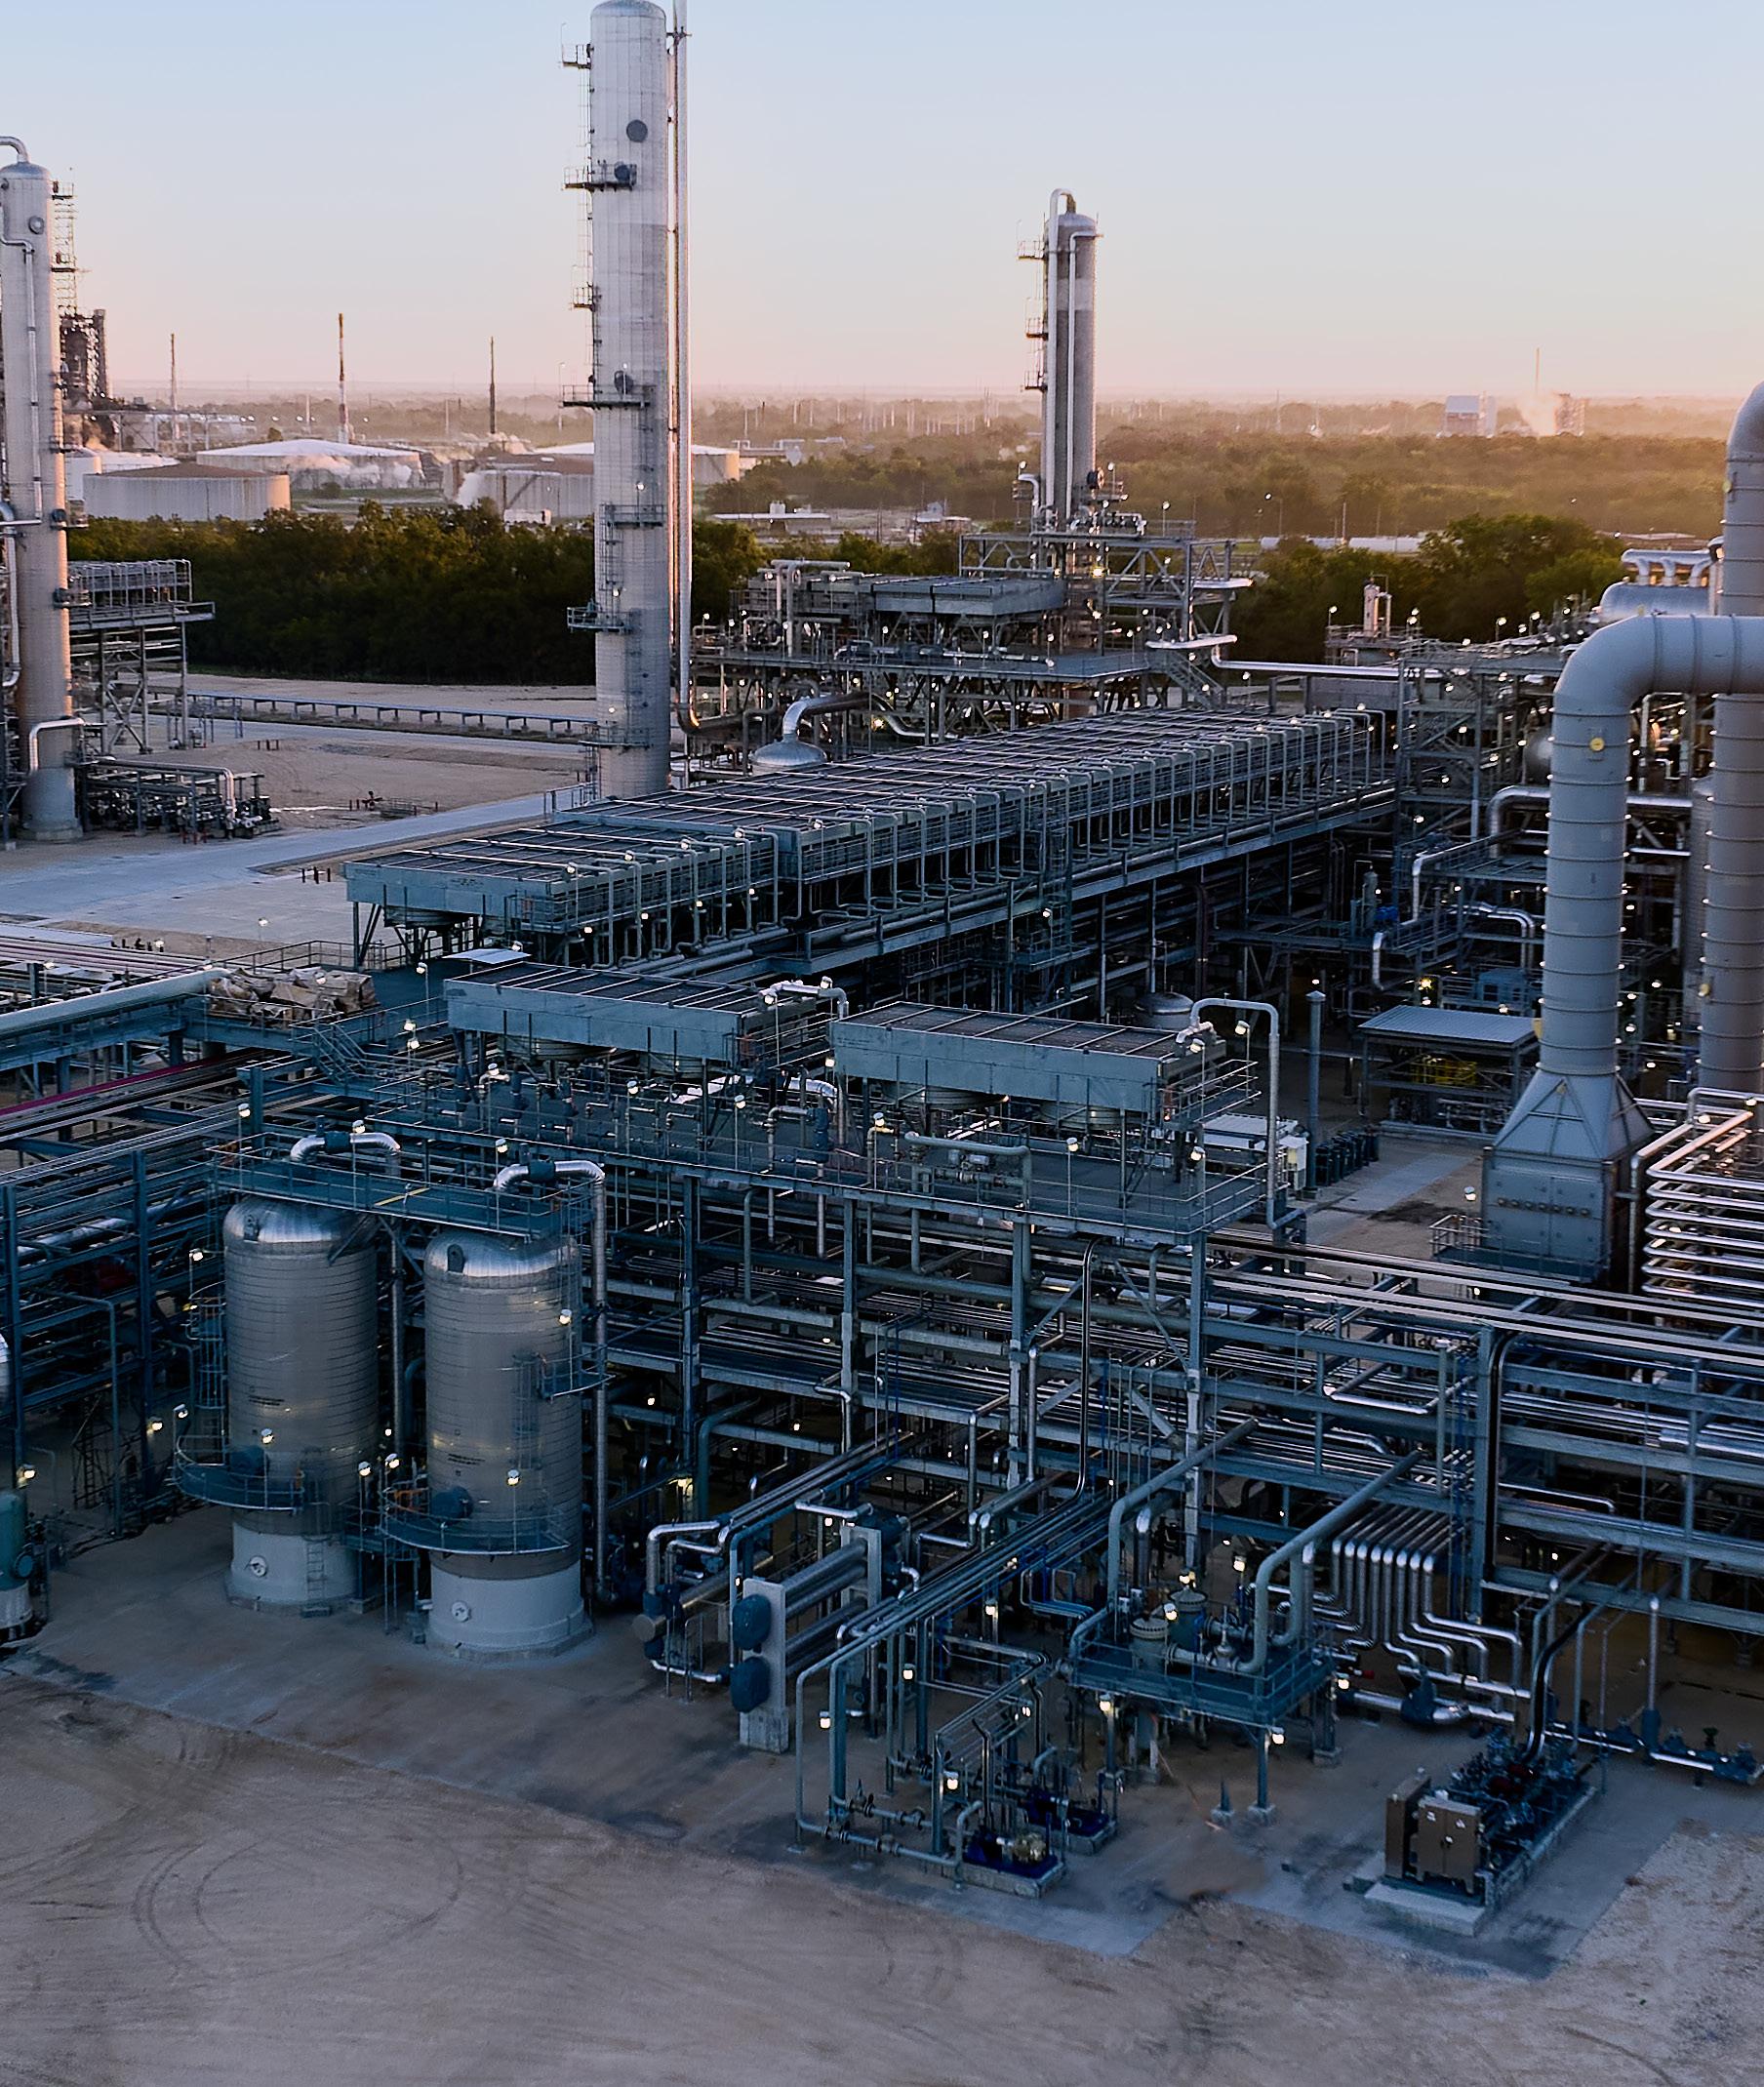
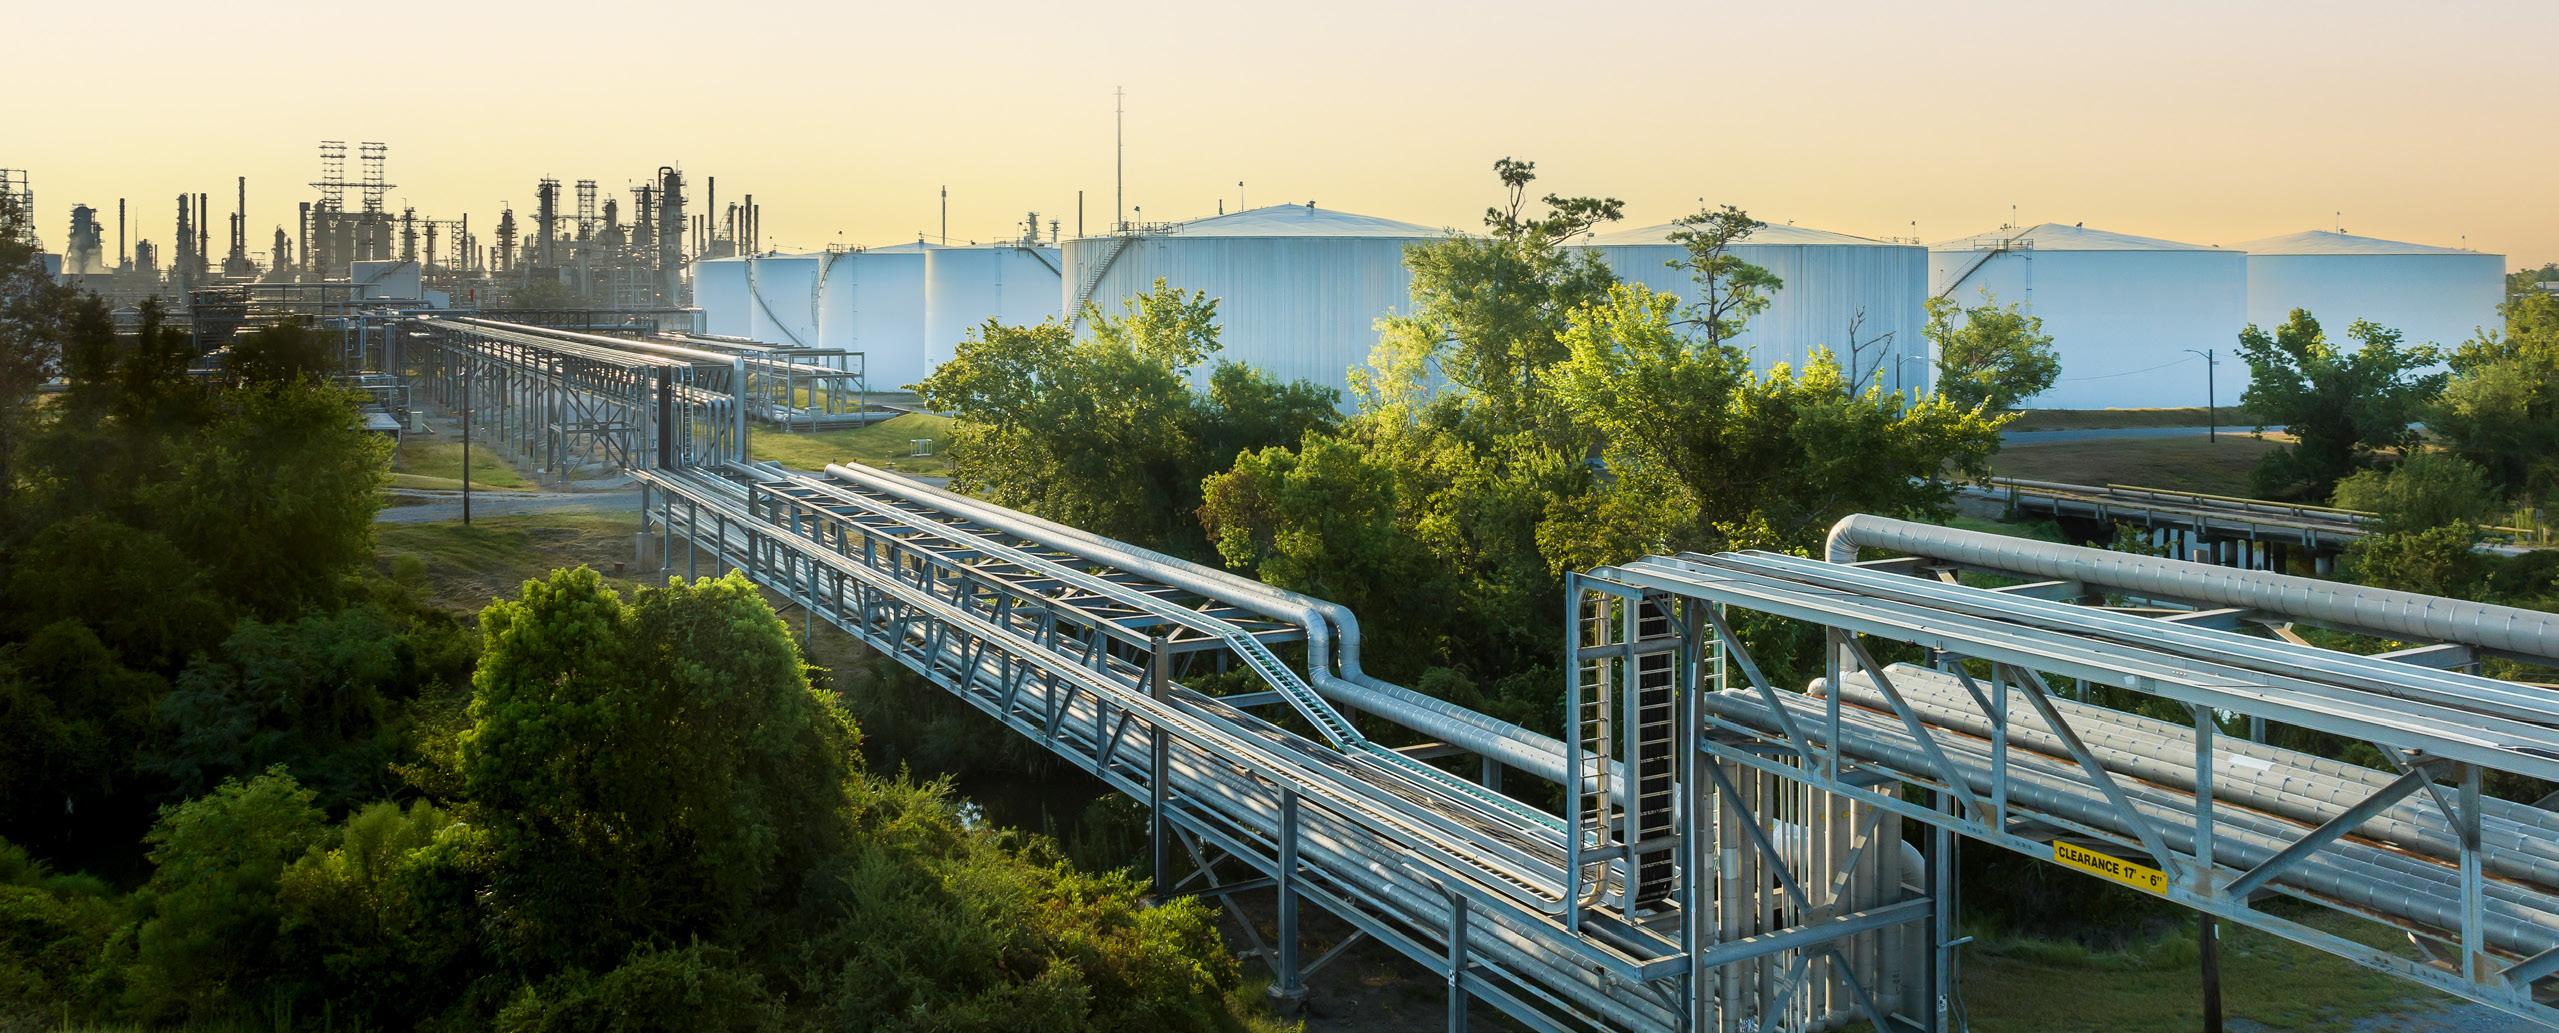
ON THE COVER: Sweeny Refinery OLD OCEAN, TX
We create space for possibilities.
Seek different perspectives. Championing inclusion enables us to innovate and thrive.
We challenge ourselves and never settle.
Achieve excellence.
Continuing to improve ensures we deliver extraordinary performance.
This Year in Review contains forward-looking statements and non-GAAP financial measures. Refer to the Appendix for the Cautionary Note on Forward-Looking Statements and for more information on the non-GAAP financial measures.
2 PHILLIPS 66 2023 YEAR IN REVIEW

President and CEO Letter 4 Financial Highlights 14 Strategy Strategic Priorities Business Overview Diversified and Integrated Portfolio 6 Appendix Non-GAAP Reconciliations Shareholder Information 28 Operating Excellence 20 Leadership Board of Directors Executive Leadership Team 24 Rawhide Gas Plant BIG SPRING, TX 3
To Our Shareholders,
Phillips 66 is the leading integrated downstream energy provider, supported by our dedicated people and diversified asset base and guided by our values of safety, honor and commitment. As we continue to deliver on our mission of providing energy and improving lives, it is with a deep sense of pride and gratitude that I share the highlights of 2023 — a year that reaffirmed our commitment to delivering value to our shareholders.
Phillips 66 achieved 33% total shareholder return during 2023, among the top-performing energy stocks.
Delivering Strong Results
33%
total shareholder return
In 2023, we delivered strong earnings of $7 billion and earnings per share of $15.48. Adjusted earnings were $7.2 billion, or $15.81 per share. Our operating and commercial excellence allowed us to capture value across our diversified and integrated portfolio.
During the year, we generated $7 billion of operating cash flow. We reinvested $2.4 billion back into the business and returned $5.9 billion to shareholders through dividends and share repurchases. Our ending cash balance was $3.3 billion.
In 2023, we increased our quarterly dividend by 8%, reflecting our commitment to a secure, competitive and growing dividend, resulting in a 16% compound annual growth rate since our formation in 2012. The company has returned $39 billion to shareholders through dividends, share repurchases and a share exchange since 2012.
$5.9B
of operating cash flow
$7B reinvested back into the business
returned to shareholders
Strategic Priorities
Building upon our substantial progress toward our 2022 Investor Day commitments, we announced enhanced and ambitious yet achievable plans to reward shareholders now and well into the future. Key highlights of these commitments include:
• Increasing our mid-cycle adjusted EBITDA to $14 billion by 2025.
• Raising our shareholder distribution target to a range of $13 billion to $15 billion from July 2022 through year-end 2024, with a plan to return at least 50% of operating cash flow to shareholders.
$2.4B
returned to shareholders since 2012 $39B
• Approving an additional $5 billion in share repurchase authorization. Since 2012, the board has authorized share repurchases totaling $25 billion.
• Targeting $1.4 billion in run-rate cost and capital reductions by the end of 2024 through business transformation initiatives. Our employees are consistently challenging the status quo to improve how we work.
• Announcing plans to monetize assets that no longer fit our long-term strategy, with the expected proceeds of more than $3 billion to advance strategic priorities, including returns to shareholders.
STRATEGY FINANCIAL HIGHLIGHTS OPERATING EXCELLENCE LEADERSHIP APPENDIX PRESIDENT AND CEO LETTER
4 PHILLIPS 66 2023 YEAR IN REVIEW
Operating Excellence
We are dedicated to operating excellence and prioritizing safety for our people and communities. In 2023, we delivered outstanding achievements, including record-low safety rates, significant business transformation savings and strategic advancements across our businesses.
• The company’s combined workforce total recordable rate of 0.12 was our best-ever and more than 25 times better than the 2022 U.S. manufacturing average. Our lost workday case rate was 0.04 or 7.5 times better than the 2022 U.S. refining industry average.
• We achieved $1.2 billion in run-rate cost and capital savings through business transformation initiatives.
• In Midstream, we continued to advance our NGL wellhead-to-market strategy with the acquisition of all outstanding public common units of DCP Midstream, LP. The team has done a remarkable job integrating DCP, and captured runrate synergies of $250 million as of year-end 2023.
• In Chemicals, CPChem completed construction and began operations of a 586 million pounds per year 1-hexene unit and 1 billion pounds per year propylene splitter. CPChem also continued to advance world-scale petrochemical facilities with a joint venture partner on the U.S. Gulf Coast and in Ras Laffan, Qatar.
• We continued enhancing Refining operational performance and ran above-industry average crude utilization for four consecutive quarters. In addition, we completed high-return, low-capital projects to improve market capture.
• We progressed construction on the Rodeo Renewed project to convert our San Francisco Refinery into one of the world’s largest renewable fuels facilities. The conversion project produces lower-carbon intensity fuels and lower emissions from the facility.
• Marketing and Specialties continued to generate strong earnings and enhanced its renewable fuel distribution network by acquiring a marketing business on the U.S. West Coast to optimize the placement of renewable diesel that will be produced at the Rodeo facility.
Investing in Our Communities
Beyond financial and operational success, we believe in building stronger, safer and more resilient communities. In 2023, we contributed $30 million to education, safety and well-being, environmental projects and social advancement. These investments support valuable partners from fire departments and first responders to STEM educators and community service providers to strengthen the cities and towns we have been part of for generations. It didn’t stop there. Our employees contributed 96,000 service hours and $8 million in volunteer grants and matching gifts to their communities as a part of the company’s overall investment.
Powering Ahead With Purpose
Our progress over the past year, enhanced strategic priorities and clear path forward, position us for success across all our businesses in 2024. Our strategy in Midstream, Chemicals, Refining and Marketing and Specialties is strengthened by our high-performing organization’s commitment to operating excellence. We are committed to safely and reliably providing energy and improving lives while pursuing a lower-carbon future. Our resilient team is energized, optimistic about the future and ready to deliver on our strategic priorities to create significant value for shareholders.
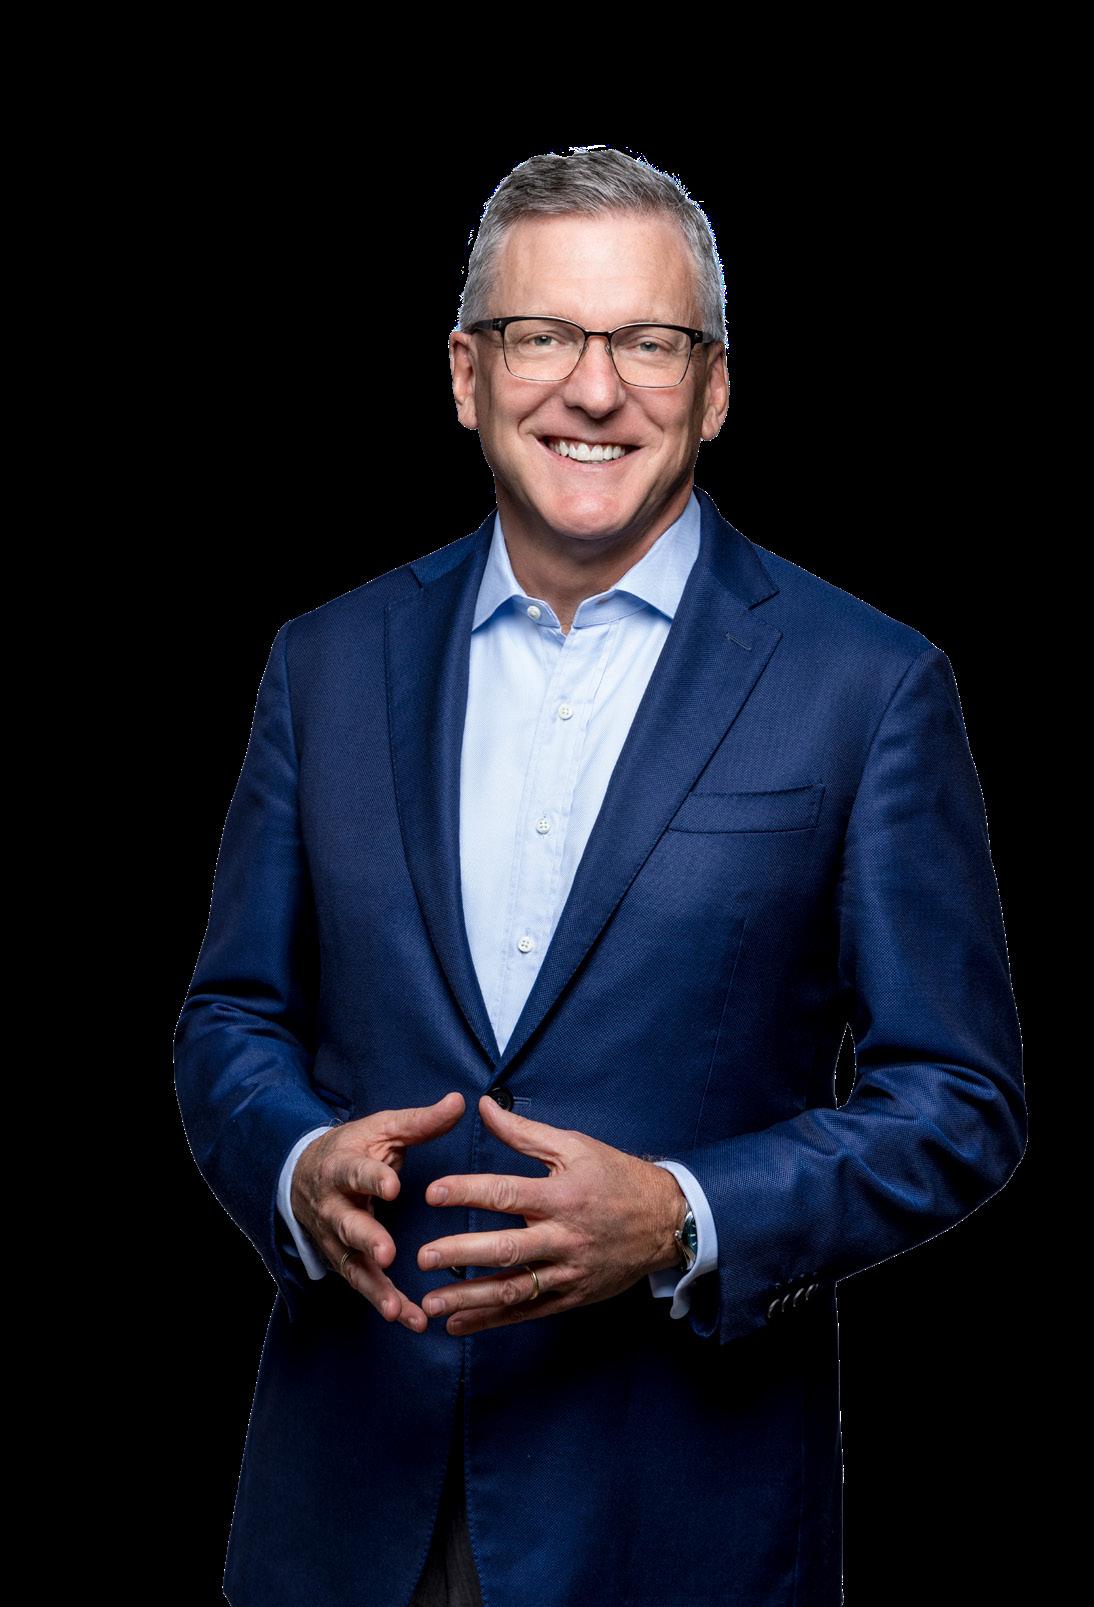
Sincerely,
 Mark Lashier President and CEO
5
Strategy
PRESIDENT AND CEO LETTER
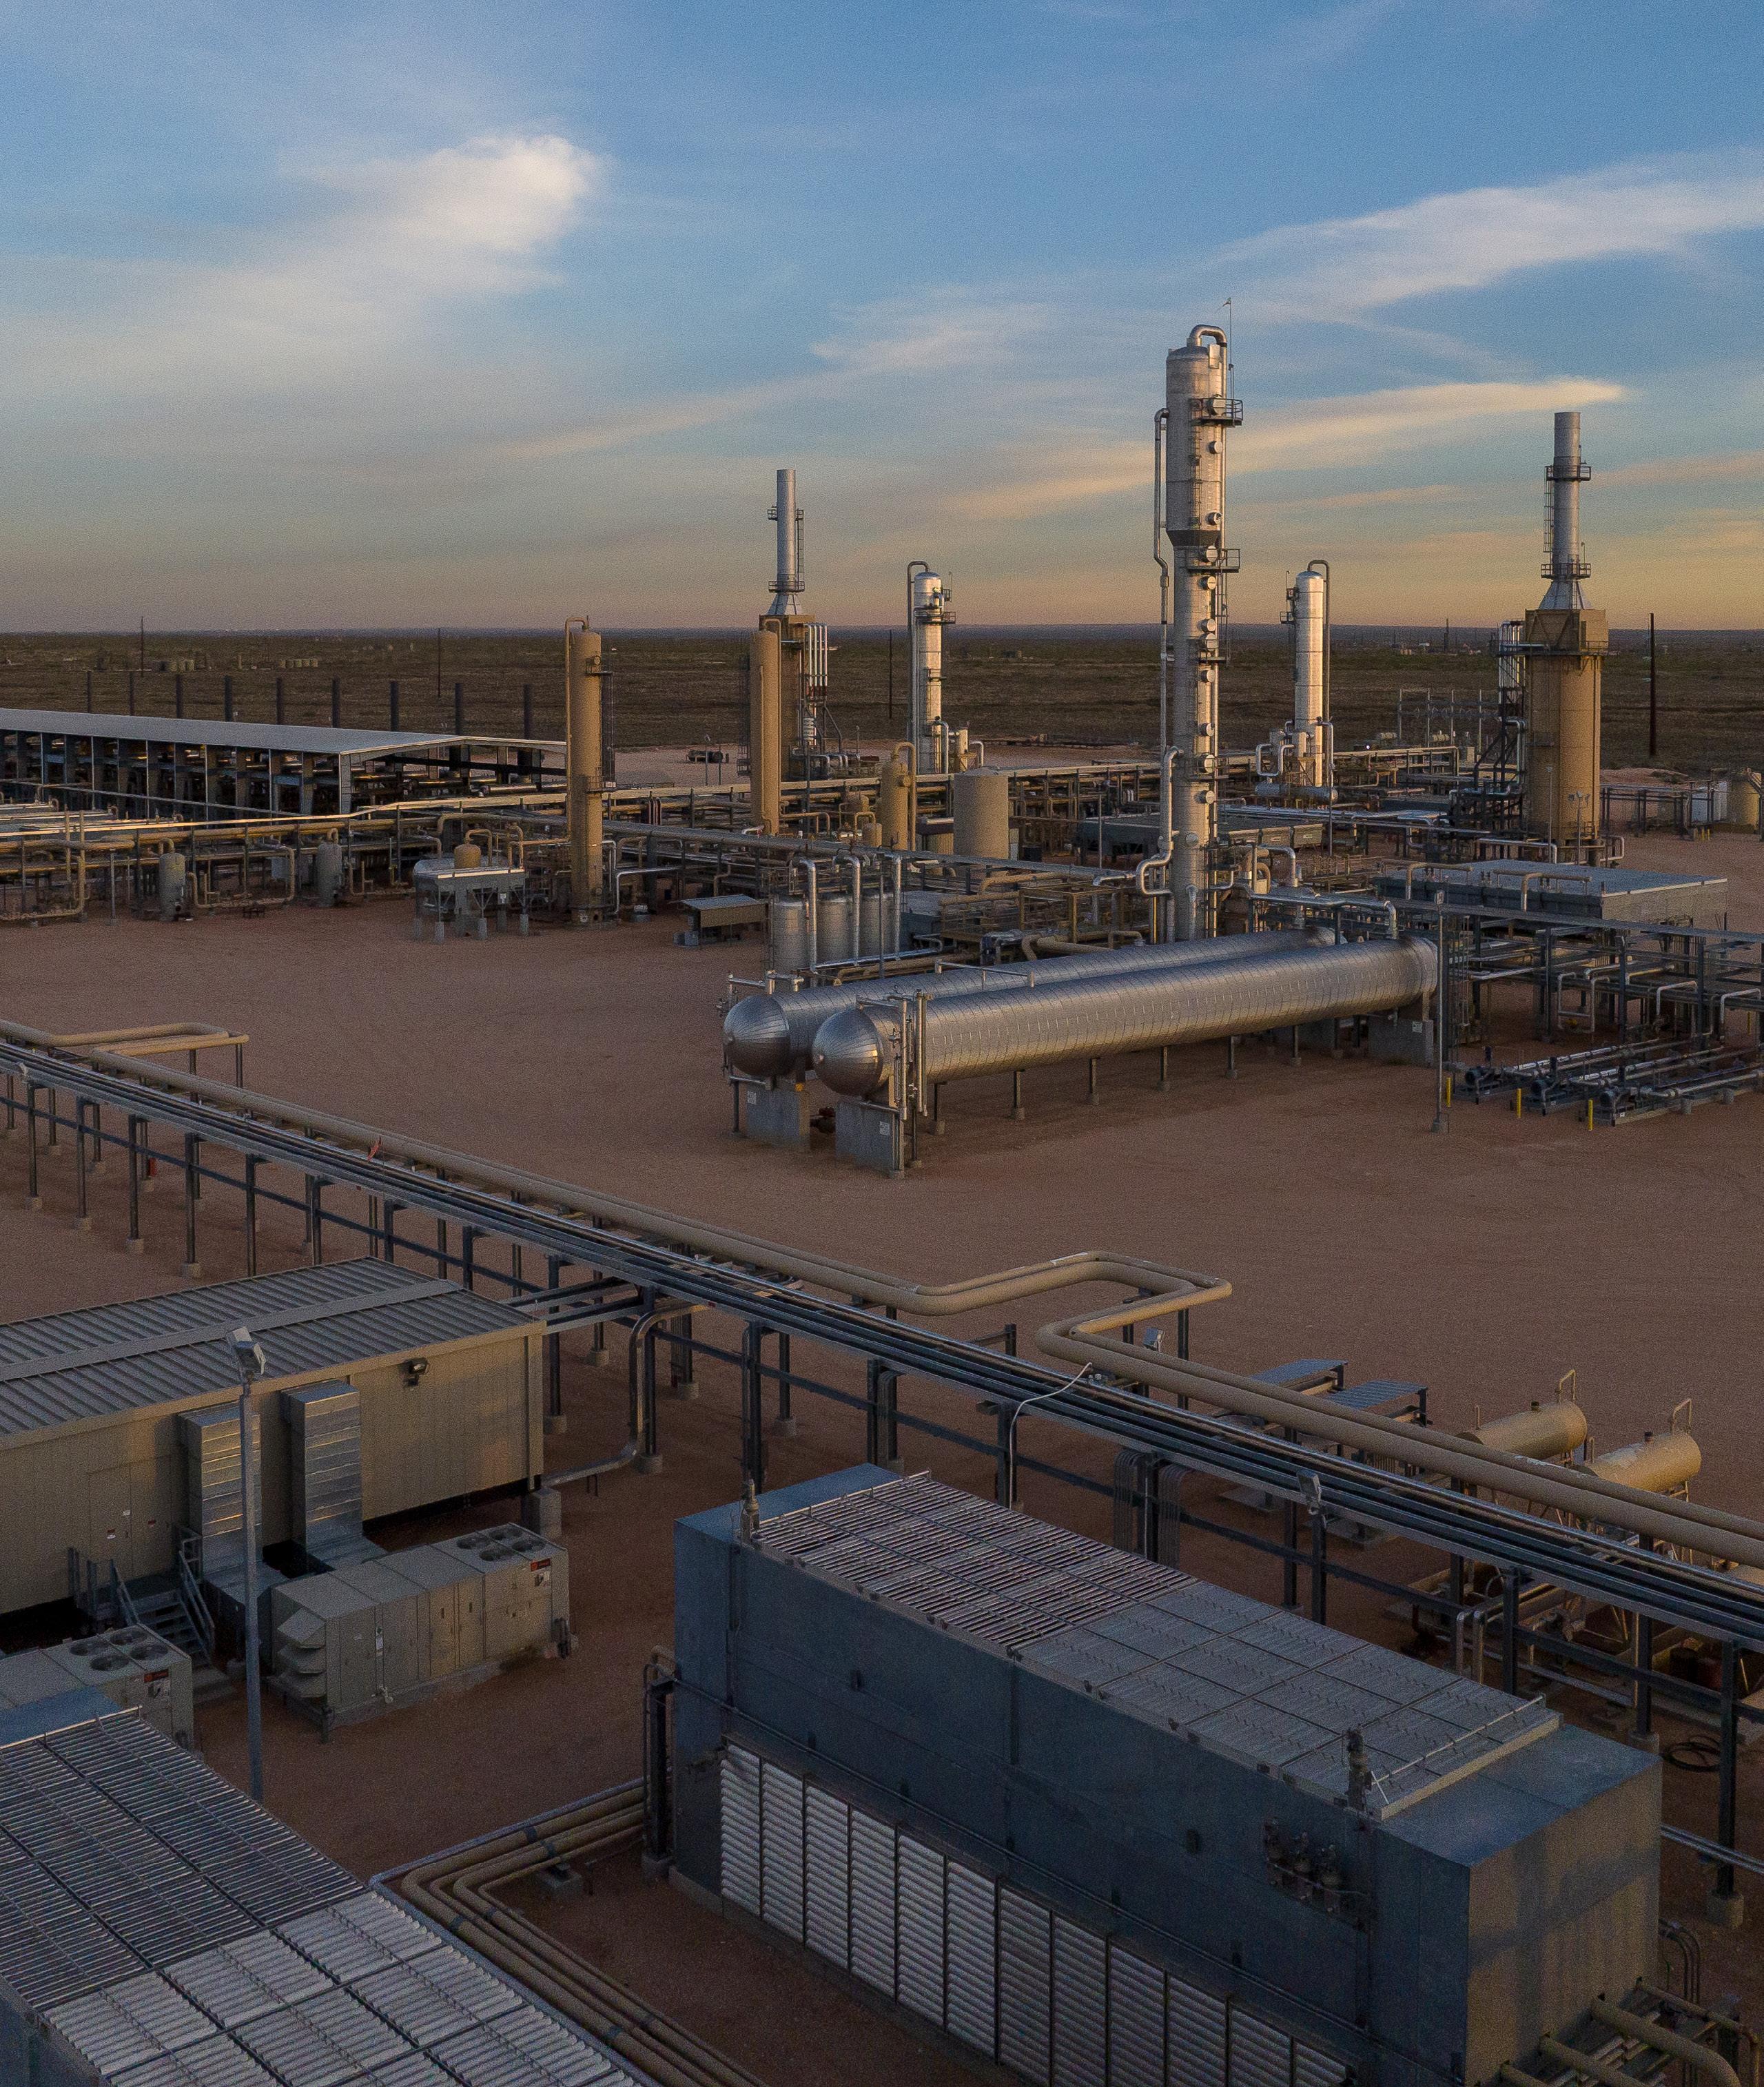
Zia II Gas Plant HOBBS, NM
STRATEGY FINANCIAL HIGHLIGHTS OPERATING EXCELLENCE LEADERSHIP APPENDIX 6 PHILLIPS 66 2023 YEAR IN REVIEW
Leading Integrated Downstream Energy Provider
Positioned for value creation through economic cycles
Phillips 66 is the leading integrated downstream energy provider, supported by the values of safety, honor and commitment. Our mission is to provide energy that improves lives and contributes to meeting the world’s growing energy needs.
A strong foundation of operating excellence and our high-performing organization underpin our integrated assets in Midstream, Chemicals, Refining and Marketing and Specialties. We also pursue solutions that support a lower-carbon future.
In Midstream, the Transportation and NGL businesses are highly integrated with our other assets, and we are expanding our NGL wellhead-to-market services to capture growth opportunities.
MIDSTREAM
Wellhead to market and highly integrated with other segments
• NGL wellhead-to-market value chain.
• Crude oil and product pipelines and terminals.
• 80% fee-based.
• 72,000 miles of U.S. pipeline systems.
MARKETING & SPECIALTIES
Phillips 66®, Conoco® , 76® , Jet® and Coop branded fuels and services
• 7,260 sites in the U.S. and 1,670 international.
• Expanding high-margin retail footprint.
• Leading lubricants manufacturer in the United States.
In Chemicals, CPChem is focused on using advantaged feedstock to maintain a competitive edge.
We are committed to sustaining world-class operations that compete on a global scale in Refining and Marketing and Specialties.
We prioritize shareholder distributions and are committed to disciplined capital allocation to reward shareholders through continued dividend growth and share purchases.
CHEMICALS
Manufacture chemicals and polymers the world needs
• 95% advantaged feedstock portfolio.
• Proprietary technology and global marketing network.
SHAREHOLDER DISTRIBUTIONS
OPERATING EXCELLENCE
HIGH-PERFORMING ORGANIZATION
LOWER-CARBON
REFINING
Geographically diversified and vertically integrated
• 10 refineries in U.S.; 2 in Europe.
• 1.8 million BPD of crude capacity.*
• Increasing renewable diesel production to ~50,000 BPD.
*As of Jan. 1, 2024. Barrels per day (BPD). 7
STRATEGIC PRIORITIES
At our Investor Day in November 2022, we announced six strategic priorities that will drive sustainable value for Phillips 66’s shareholders in the near and long term. We announced targets to measure our achievements across these priorities and made significant progress toward our goals during the year. Emboldened by the early accomplishments of our workforce, we announced enhancements to our targets in October 2023.
Deliver Shareholder Returns with a target of $13 billion to $15 billion through dividends and share repurchases from July 2022 through year-end 2024.
COST REDUCTIONS
Improve Refining Performance by increasing market capture and crude capacity availability, as well as reducing adjusted controllable costs* by $1 per barrel.
Capture Value From Wellhead to Market
with the aggregate increase in our ownership of DCP Midstream, which is expected to add an incremental $1.4 billion of mid-cycle adjusted EBITDA, including targeted commercial and operating synergies.
2023 Achievements
$8.3B
distributed to shareholders through dividends and share repurchases since July 2022.
84%
of operating cash flow returned to shareholders.
STRONG REFINING OPERATIONS
with above-industry average crude utilization for four consecutive quarters.
NGL
with the acquisition of the public common units of DCP Midstream and captured run-rate synergies of $250 million as of year-end.
STRATEGY
($MM)
ADVANCED MIDSTREAM
STRATEGY
1Q 2023 $120 $400 $550 $700 $900 $260 $425 $630 $1,000 Freight and Other Costs1 Refining JV Controllable Costs3 Controllable Costs2 Run-Rate 2Q 2023 3Q 2023 YE 2023 YE 2024E $1,100 Historical and projected savings presented above are cumulative 1 Savings are reflected as a component of our purchased crude oil and product costs when realized, which is a component of segment realized margins. 2 Savings are reflected as a component of our operating and SG&A expenses when realized. 3 Proportional share of operating and SG&A expense savings of an operated, unconsolidated refining equity affiliate that are reflected in equity in earnings of affiliates when realized.
in these line items
realized, plus
operated, unconsolidated refining equity affiliates that are reflected in equity in
of affiliates
PRESIDENT AND CEO LETTER FINANCIAL HIGHLIGHTS OPERATING EXCELLENCE LEADERSHIP APPENDIX 8 PHILLIPS 66 2023 YEAR IN REVIEW
*Sum of expected operating and SG&A expense savings for our Refining segment that are
reflected
when
our proportional share of expected operating and SG&A expense savings on
earnings
when realized.
Execute Business Transformation
targeting sustainable savings of $1.4 billion annually, including $1.1 billion in cost reductions and $300 million in lower sustaining capital.
Maintain Financial Strength and Flexibility
by delivering expected mid-cycle adjusted EBITDA growth of $4 billion to $14 billion by 2025, prioritizing our strong investment-grade credit ratings and targeting a 25% to 30% net debt-to-capital ratio. We also plan to monetize assets that no longer fit our long-term strategy and expect to generate over $3 billion in proceeds from these asset sales.
ADJUSTED EBITDA BY SEGMENT
Drive Disciplined Growth and Returns
through disciplined capital allocation. Our ability to deliver secure, competitive and growing shareholder distributions in the future will be enabled by pursuing selective, returns-focused growth today. We take a disciplined approach to capital allocation with a target of returning at least 50% of our cash from operations to shareholders.
$1.2B
in business transformation run-rate savings, comprised of $900 million of cost reductions and $300 million of lower sustaining capital.
$392MM
proceeds from asset dispositions.
RODEO RENEWED
advanced project to convert our San Francisco Refinery into a renewable fuels facility.
San Francisco Refinery RODEO, CA
2025 Mid-Cycle Adjusted EBITDA Target $14 $10 $7.7 2022 Mid-Cycle Adjusted EBITDA Target 2017-2019 Average Adjusted EBITDA Midstream Refining Renewables Marketing & Specialties Chemicals 9
($B)
BUSINESS OVERVIEW
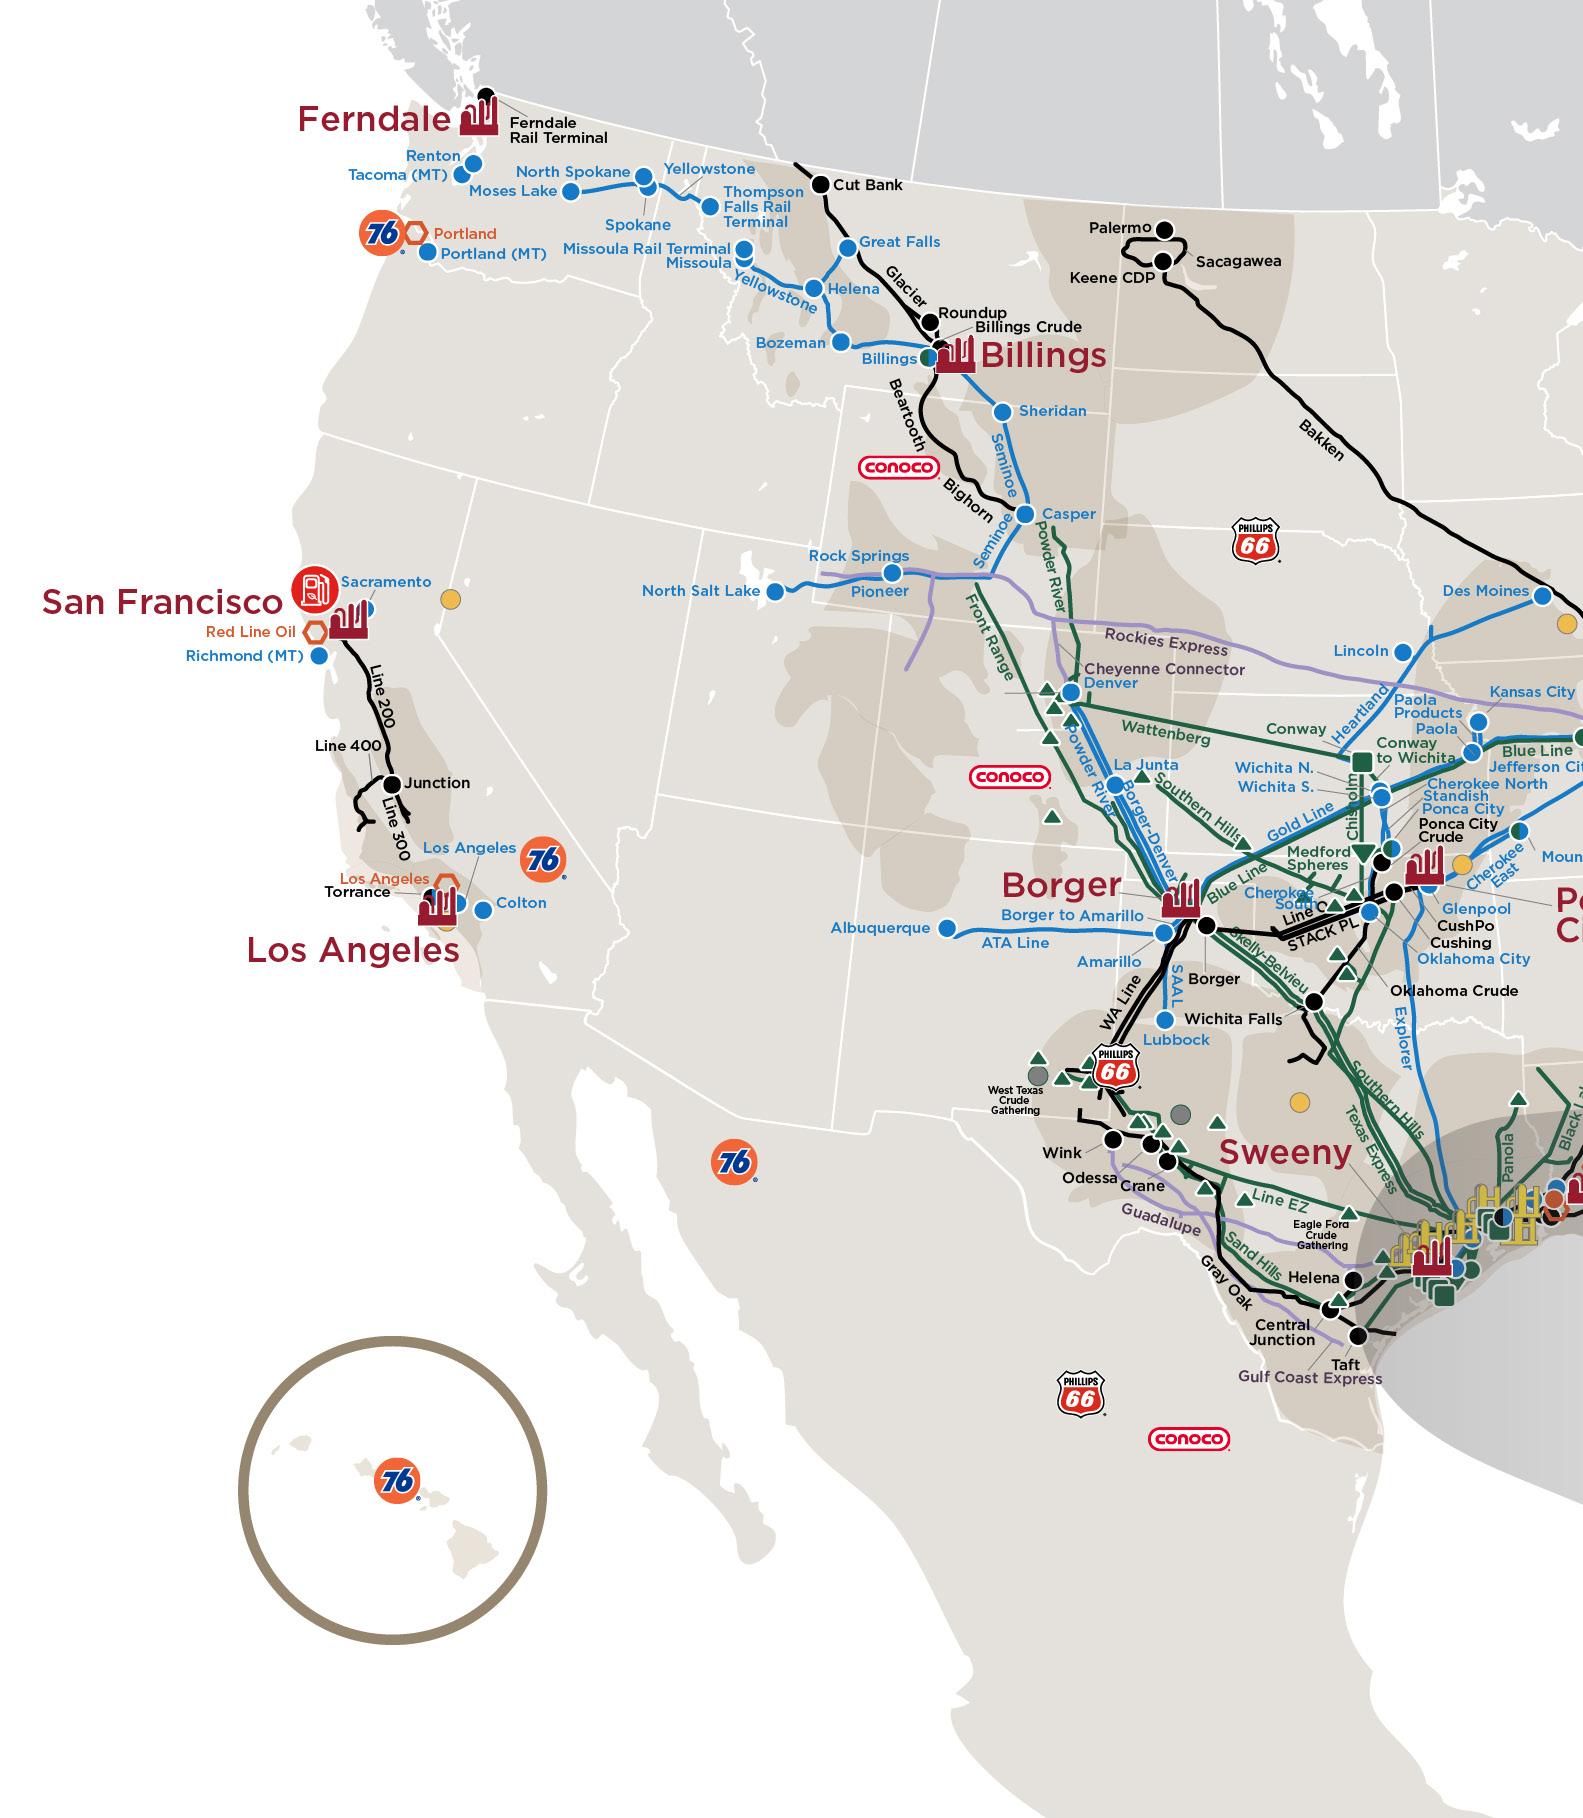
We are differentiated by an integrated network of businesses and assets across the energy value chain. Our diverse portfolio positions us to generate free cash flow through economic cycles.
Midstream
Our Midstream assets are highly integrated with our Refining, Marketing and Specialties and Chemicals assets. The business is focused on two primary areas:
• Crude oil and products transportation, terminaling and processing services.
• NGL wellhead-to-market value chain.
Our NGL wellhead-to-market value chain includes natural gas and NGL gathering and processing, transportation, storage, fractionation and marketing services. Our Sweeny Hub is strategically located on the U.S. Gulf Coast, with access to domestic and international petrochemicals, fuels and liquefied petroleum gas (LPG) markets. It is integrated with our Sweeny Refinery and offers worldclass fractionation, cavern storage and export capability.
Chemicals
Our 50% equity investment in CPChem, which manufactures and markets petrochemicals and plastics worldwide, is the basis for our Chemicals business. CPChem owns proprietary technology and has worldscale, cost-advantaged facilities concentrated in North America and the Middle East.
CPChem is one of the world’s top producers of olefins and polyolefins, normal alpha olefins and high-density polyethylene. Additionally, CPChem is a leading supplier of aromatics, alpha olefins, styrenics, specialty chemicals, plastic piping and polymer resins, and a leading licensor of proprietary technology to make polyethylene.
72,000+
miles of U.S. pipeline capacity
719,000
BPD of fractionation capacity
BCFD of natural gas processing*
2nd largest
5.5 U.S. fractionation hub at Sweeny
30
global manufacturing facilities
research and development centers in the U.S. 2 consumer and industrial products are made from polyethylene
95%
70,000+ advantaged feedstock
STRATEGY
PRESIDENT AND CEO LETTER FINANCIAL HIGHLIGHTS OPERATING EXCELLENCE LEADERSHIP APPENDIX *Billion cubic feet per day (BCFD) Chevron Phillips Chemical | Performance by Design. Caring by Choice. 10 PHILLIPS 66 2023 YEAR IN REVIEW
Refining
Our 12 refineries in the United States and Europe refine crude oil and other feedstocks into petroleum products, such as gasoline, distillates and aviation fuels, as well as renewable fuels. Our Refining business focuses on operating excellence and margin enhancement. We strengthen returns by improving yields of higher-value products and increasing the throughput of advantaged feedstocks. We process a diversified crude slate that is approximately one-third each of light, medium and heavy grades.
Our Refining assets are some of the most competitive in the industry. Their integration with our other businesses provides us with flexibility and optionality. Our commercial Value Chain Optimization organization maximizes profitability across our integrated system.
Renewable fuels like renewable diesel, sustainable aviation fuel (SAF) and renewable naphtha are an extension of our current business and allow us to use existing infrastructure in new ways to meet changing energy needs. We produce renewable fuels at the San Francisco Refinery in Rodeo, California, and the Humber Refinery in the U.K. We are converting our San Francisco Refinery into one of the world’s largest renewable fuels facilities with over 50,000 barrels per day (800 million gallons per year) of renewable fuel production capacity. Additionally, processing pyrolysis oil from waste plastics allows us to make feedstocks for new plastics.
Marketing and Specialties
We market refined petroleum products and renewable fuels, mainly in the United States and Europe. This segment includes the manufacturing and marketing of specialty products, such as base oils and lubricants. We are a leading lubricants manufacturer in the United States.
Marketing and Specialties is a high-return, low-capital business that provides strong cash generation. Our Marketing business supports the placement of our products, providing optionality and incremental value generation.
We are focused on increasing the placement of traditional and renewable fuels to end users to capture greater value.
1,670
branded U.S. outlets
branded international outlets
7,260
branded retail sites in California sell renewable diesel 600 Crude Infrastructure Refining Clean Products Infrastructure Renewable Fuels Marketing & Specialties Chemicals Fractionation Long Haul Pipelines Gathering and Processing Retail and Wholesale Markets Global Chemicals Markets Natural Gas Markets Natural Gas/NGLs Crude Oil OUR INTEGRATED DOWNSTREAM VALUE CHAIN Global LPG Markets Midstream Marketing & Specialties Refining Chemicals Renewables million BPD of crude throughput capacity* 1.8 global facilities producing renewable fuels 2 *As of Jan. 1, 2024 11
AND INTEGRATED PORTFOLIO STRATEGY PRESIDENT AND CEO LETTER FINANCIAL HIGHLIGHTS OPERATING EXCELLENCE LEADERSHIP APPENDIX 12 PHILLIPS 66 2023 YEAR IN REVIEW
DIVERSIFIED
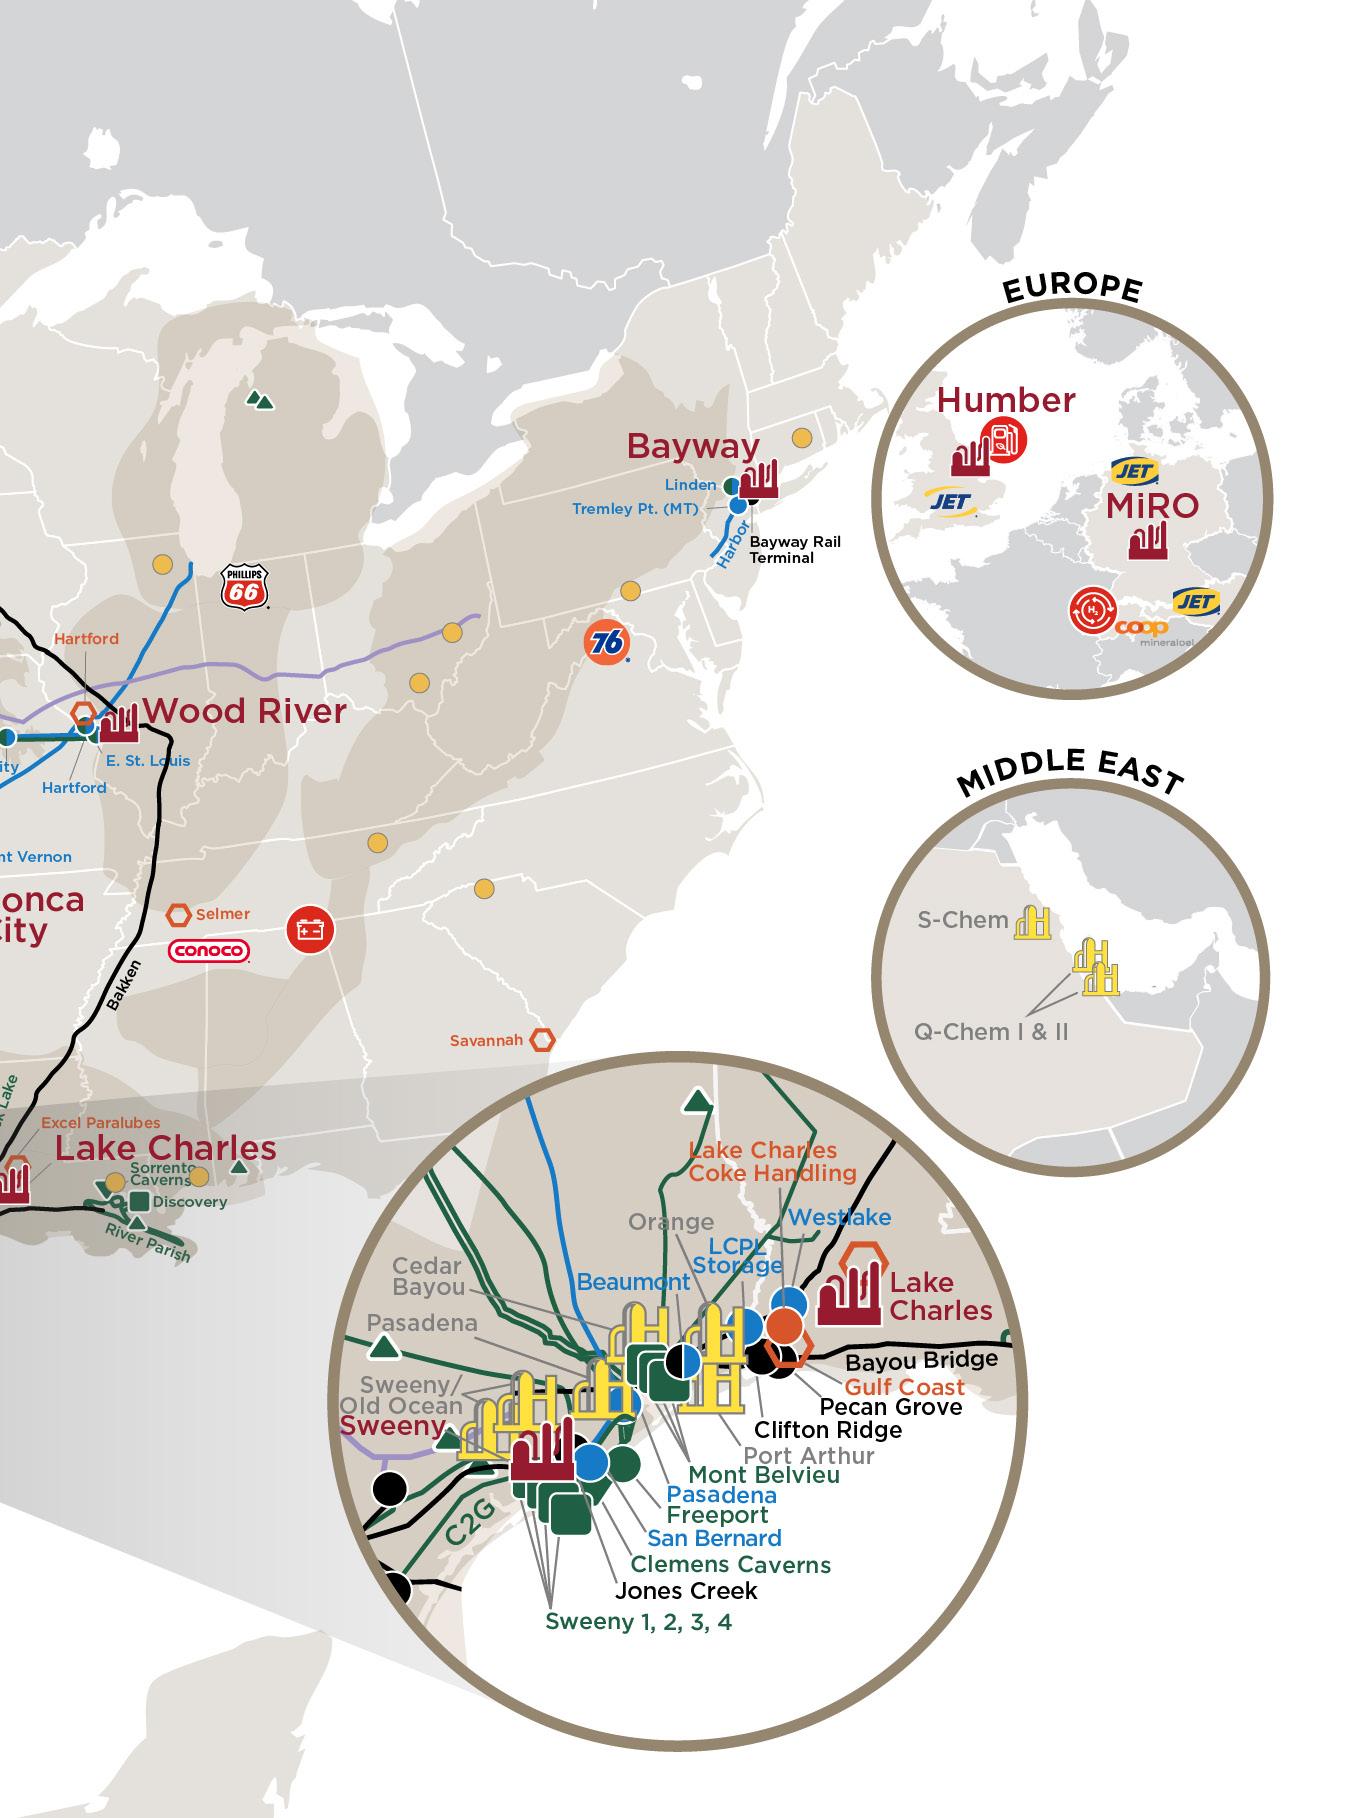
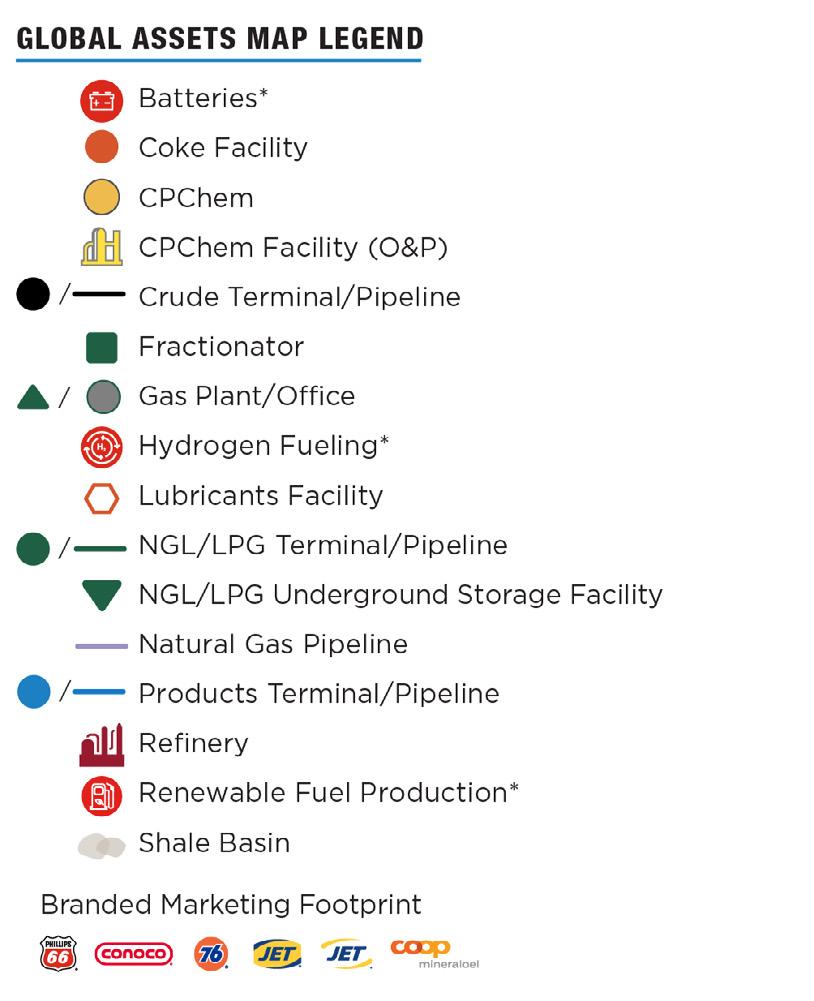
*Includes Emerging Energy opportunities projected to begin in marked locations. As of December 2023 13
Financial Highlights
PRESIDENT AND CEO LETTER STRATEGY FINANCIAL HIGHLIGHTS OPERATING EXCELLENCE LEADERSHIP APPENDIX
14 PHILLIPS 66 2023 YEAR IN REVIEW
Sweeny Refinery OLD OCEAN, TX
We manufacture, transport and market products that drive the global economy.
15
We delivered strong financial and operating results as we executed on our strategic priorities to increase shareholder value.
Our 2023 earnings were $7 billion, or $15.48 per share. Adjusted earnings were $7.2 billion, or $15.81 per share.
During 2023, we generated $7 billion in cash from operations.
We funded capital spending of $2.4 billion, repurchased $4 billion in shares and paid $1.9 billion in dividends.
At year-end, our total debt balance was $19.4 billion, an increase of $2.2 billion from the prior year. The increase primarily reflects borrowings to support the acquisition of all outstanding public common units of DCP Midstream, LP. Our disciplined approach to capital allocation across our portfolio has contributed to an average return on capital employed (ROCE) of 13% since our formation in 2012.
Phillips 66 (PSX) is committed to financial discipline, including a strong balance sheet and investment-grade credit ratings.
A3 (Moody’s), BBB+ (S&P) strong investment-grade credit rating since 2014
FINANCIAL HIGHLIGHTS
(Millions of Dollars, Except Per Share Amounts) 2023 2022 2021 Sales and other operating revenues $147,399 $169,990 $111,476 Income before income taxes 9,469 14,639 1,740 Net income 7,239 11,391 1,594 Net income attributable to Phillips 66 7,015 11,024 1,317 Per share of common stock Basic 15.56 23.36 2.97 Diluted 15.48 23.27 2.97 Cash and cash equivalents 3,323 6,133 3,147 Total assets 75,501 76,442 55,594 Total debt 19,359 17,190 14,448 Total equity 31,650 34,106 21,637 Cash from operating activities 7,029 10,813 6,017 Cash dividends declared per common share 4.20 3.83 3.62 Adjusted earnings 7,163 8,901 2,521 Adjusted earnings per share 15.81 18.79 5.70 FINANCIAL HIGHLIGHTS cash from operations $7B earnings, or $15.48 per share $7B adjusted earnings, or $15.81 per share $7.2B total liquidity as of Dec. 31, 2023 $9.7B FINANCIAL HIGHLIGHTS Form 10-K PRESIDENT AND CEO LETTER STRATEGY OPERATING EXCELLENCE LEADERSHIP APPENDIX
16 PHILLIPS 66 2023 YEAR IN REVIEW

2024 Capital Program
Our 2024 capital budget is $2.2 billion, comprised of $923 million of sustaining capital and $1.3 billion for growth capital. Excluding joint venture debt repayments due in 2024, our 2024 capital budget is $2 billion.
The sustaining capital budget reflects $300 million of efficiencies as a result of our business transformation efforts. Growth capital supports our NGL wellhead-to-market value chain, completing the Rodeo renewable
Feb-24 -20% 80% 180% 280% 380% 480% 580% May-12 May-13 May-14 May-15 May-16 May-17 May-18 May-19 May-20 May-21 May-22 May-23 Share price as of February 29, 2024. See appendix for additional footnotes. 1 Phillips 66 S&P 100 Peers*
Bloomberg.
Source:
total shareholder return May 1, 2012,
Feb. 29, 2024.
Chart reflects
to
Dividends assumed to be reinvested in stock.
May-23 May-22 May-21 May-20 May-19 May-18 May-17 May-16 May-15 May-14 May-13 May-12 -20% 80% 180% 280% 380% 480% 580%
*Presented on a simple average basis using CVR Energy, Inc.; Delek US Holdings, Inc.; Dow Inc.; HF Sinclair Corporation; LyondellBasell Industries N.V.; Marathon Petroleum Corporation; ONEOK, Inc.; PBF Energy Inc.; Targa Resources Corp.; The Williams Companies, Inc.; Valero Energy Corporation; Westlake Corporation.
TOTAL SHAREHOLDER RETURN CAPITAL STRUCTURE 21.6 40% 34% ($ in billions) 14.4 34% 24% 2022 2023 2021 3.1 34.1 31.7 17.2 19.4 6.1 3.3 38% 34% Equity Debt Cash and cash equivalents Debt-to-capital Net debt-to-capital ADJUSTED EARNINGS ($ in billions) 2.5 7.2 8.9 2023 2021 2022 ADJUSTED ROCE Adjusted Return on Capital Employed (%) 9 16 22 2023 2021 2022 13 2012 - 2023 average adjusted ROCE Feb-24 17
fuels facility and enhancing Refining performance. We are returns-focused and will invest only in projects that exceed our hurdle rates.
The Midstream growth budget of $593 million includes $250 million related to the repayment of our 25% share of a midstream joint venture’s debt. In Refining and Marketing and Specialties, we are investing $715 million to support high-return projects.
Our proportionate share of capital spending by our major joint ventures, Chevron Phillips Chemical Company LLC (CPChem) and WRB Refining LP, is expected to be $1 billion and self-funded.
Distributions
CAPITAL SPENDING
We prioritize distributions to our shareholders and continue delivering value through a secure, competitive and growing dividend and share repurchases. We are targeting to return $13 billion to $15 billion to shareholders through dividends and share repurchases from July 2022 through year-end 2024.
Since the company was formed in 2012, we have returned $39 billion through dividends, share repurchases and a share exchange, which equates to 185% of our original market capitalization. We have increased our annual dividend every year, resulting in a compound annual growth rate (CAGR) of 16%. We have reduced our original shares outstanding by 31%.
16% ($
compound annual growth rate with 12 increases since May 2012
in billions)
*Midstream growth capital includes $250 million related to the repayment of the company’s 25% share of a joint venture’s debt due in 2024.
2.2 2.4 2.2 1.9 2022 2023 2024 Budget 2021 FINANCIAL HIGHLIGHTS
Growth* Sustaining PRESIDENT AND CEO LETTER STRATEGY OPERATING EXCELLENCE LEADERSHIP APPENDIX 18 PHILLIPS 66 2023 YEAR IN REVIEW
Lake Charles Refinery WESTLAKE, LA
(Annual $/share) SHARE COUNT DIVIDEND GROWTH 16% CAGR 2.18 3.10 3.50 3.60 3.62 3.83 4.20 1.33 2.45 1.89 2.73 2015 2018 2021 2022 2023 2013 2016 2019 2014 2017 2020 31% reduction in shares outstanding 626 million 430 million 2012 2013 2014 2015 2016 2017 2018 2019 2020 2021 2022 2023 CUMULATIVE SHAREHOLDER DISTRIBUTIONS Dividends Share Repurchases and Share Exchange 2012 1 2013 4 2014 8 2015 11 2016 13 2017 16 2018 22 2019 26 2020 28 2021 29 2022 33 2023 39
CITY, OK ($ in billions) 19
Ponca City Refinery PONCA

Operating Excellence
PRESIDENT AND CEO LETTER STRATEGY FINANCIAL HIGHLIGHTS LEADERSHIP APPENDIX Billings Refinery BILLINGS, MT
OPERATING EXCELLENCE 20 PHILLIPS 66 2023 YEAR IN REVIEW
We are committed to safety, environmental stewardship, sustainability, reliability and cost efficiency while protecting shareholder value.
21
OPERATING EXCELLENCE
Operating excellence is foundational to everything we do, and safety is core to who we are. By prioritizing operating excellence, we are creating value for our shareholders. We have a robust health, safety and environmental program and strive toward a zero-incident, zero-injury workplace.
We continue to reinforce our safety culture, including the ongoing integration of DCP Midstream. Our 2023 combined employee and contractor workforce total recordable rate was 0.12. That is more than 25 times better than the U.S. average manufacturing facility rate of 3.2. Our lost workday case rate was 0.04 last year, approximately 7.5 times better than the U.S. refining average, and our Tier 1 process safety event rate was 0.06.
Using digital technology helps us optimize our operations and transforms how we think about our business. We leverage data analytics, machine learning and artificial intelligence to elevate our operational performance, enhance asset reliability and make quicker, more informed decisions.
In Refining, we achieved 92% crude capacity utilization and a clean product yield of 85%, including a distillate yield of 39%. We are committed to cost discipline and consistently participate in industry benchmarking to ensure that we maintain our competitive cost structure.
In Midstream, we are focused on the reliability and integrity of our gas plants, pipelines, terminals and fractionators. The Sweeny Hub is the second-largest fractionation hub in the U.S. In 2023, the Freeport LPG Export Terminal loaded a record 279,000 barrels per day. The Sweeny Hub fractionation complex averaged 595,000 barrels per day, reaching record rates.
In Chemicals, CPChem demonstrated reliability by consistently operating at rates better than the industry average. In 2023, CPChem’s global Olefins and Polyolefins (O&P) capacity utilization rate was 96%.
CPChem and its employees focus on safe, reliable operations, committing to the highest standards in operating excellence. CPChem achieved a total recordable rate of 0.08, more than 40 times better than the U.S. average manufacturing facility rate. CPChem’s combined Tier 1 and 2 process safety event rate was 0.06.
Sustainability
Sustainability shapes how we define and execute our strategy, which supports our long-term resilience and competitiveness.
We are focused on maintaining a strong and resilient business that contributes to meeting global energy demands while operating safely, strengthening communities and protecting the environment.
We are committed to strong ESG principles and to our shareholders, our people and the communities in which we operate and where we work. Prioritizing sustainability positions Phillips 66 for long-term resiliency and creates shareholder value.
We are guided by our sustainability pillars of environmental stewardship, social responsibility and governance, as well as operating excellence and financial performance. These pillars ensure we have a thriving business today and in the future.
For additional sustainability metrics and disclosures:
OPERATING EXCELLENCE
2023 Sustainability Report
PRESIDENT AND CEO LETTER STRATEGY FINANCIAL HIGHLIGHTS LEADERSHIP APPENDIX 22 PHILLIPS 66 2023 YEAR IN REVIEW
Emissions Reduction at a Glance
2021 utilization impacted by severe winter storms on the U.S. Gulf Coast in 1Q 2021; excludes Alliance Refinery beginning in 4Q 2021. 2023 reflects reduced capacity of our San Francisco Refinery in Rodeo, California, from the shutdown of the Santa Maria Refinery in February 2023 and the shutdown of one of the Rodeo facility’s crude units in October 2023 in connection with converting this refinery into a renewable fuels facility.
Sources: Bureau of Labor Statistics, 2022 data; Phillips 66, 2023 data TOTAL RECORDABLE RATES Sources: Industry averages from American Fuel & Petrochemical Manufacturers. REFINING CRUDE CAPACITY UTILIZATION TOTAL RECORDABLE RATE BY INDUSTRY (Incidents per 200,000 hours worked) Industry Average (Incidents per 200,000 hours worked) Phillips 66 CPChem 0.28 0.12 2023 0.14 0.15 2021 2022 0.41 0.08 2023 0.32 0.32 0.10 2021 0.12 2022 90 2022 (%) 84 2021 92 2023 CPChem 1-hexene unit at the Sweeny Hub OLD OCEAN, TX All manufacturing Construction Petrochemical manufacturing Petroleum refineries Phillips 66 Professional and business services Agriculture crop production 0.12 Food manufacturing 5 4 3 2 1 0 Average of all U.S. industries, including private companies and state and local governments
23
PRESIDENT
LEADERSHIP
Board of Directors


GREG
Executive Chairman and Former CEO of Phillips 66

GARY K. ADAMS

Former Chief Advisor — Chemicals for IHS Markit

LISA A. DAVIS

Former member of the Managing Board of Siemens AG and CEO of Siemens Gas and Power

CHARLES
Former Executive Vice President and Chief Financial Officer of Walmart Inc.
GLENN F. TILTON
Lead Independent Director of Phillips 66, Former Chairman and CEO of UAL Corporation
Member of the Audit and Finance Committee
Member of the Human Resources and Compensation Committee
Member of the Nominating and Governance Committee
Member of the Public Policy and Sustainability Committee
Member of the Executive Committee
As of Feb. 13, 2024
JULIE L. BUSHMAN
Former Executive Vice President of International Operations of 3M
GREGORY J. HAYES
Chairman and CEO of RTX Corporation
AND CEO LETTER STRATEGY FINANCIAL HIGHLIGHTS OPERATING EXCELLENCE APPENDIX
LEADERSHIP
M. HOLLEY
C. GARLAND
24 PHILLIPS 66 2023 YEAR IN REVIEW


JOHN E. LOWE

Former Senior Executive Advisor to Tudor, Pickering, Holt & Co.
MARK LASHIER
President and CEO of Phillips 66
ROBERT W. PEASE


DENISE L. RAMOS
Former CEO, President and Director of ITT Inc.
Former Executive Vice President of Corporate Strategy & President, Downstream at Cenovus Energy

DOUGLAS T. TERRESON

Former Head of Energy Research at Evercore ISI
DENISE R. SINGLETON
Executive Vice President, General Counsel and Secretary of WestRock Company
MARNA C. WHITTINGTON
Former CEO of Allianz Global Investors Capital
25
LEADERSHIP
Executive Leadership Team


As of Dec. 31, 2023
TODD DENTON
Senior Vice President, Health, Safety and Environment and Field Operations Support
MARK LASHIER
President and CEO
JEFF DIETERT Vice President, Investor Relations
DAVID ERFERT
Senior Vice President, Chief Transformation Officer
ZHANNA GOLODRYGA
Executive Vice President, Emerging Energy and Sustainability
ANDREZ CARBERRY
LEADERSHIP
Senior Vice President, Chief Human Resources Officer
AND
LETTER STRATEGY FINANCIAL HIGHLIGHTS OPERATING EXCELLENCE APPENDIX
PRESIDENT
CEO
26 PHILLIPS 66 2023 YEAR IN REVIEW


BRIAN MANDELL

Executive Vice President, Marketing and Commercial

TANDRA PERKINS
Senior Vice President, Chief Digital and Administrative Officer

RICH HARBISON
Executive Vice President, Refining
KEVIN MITCHELL
Executive Vice President and Chief Financial Officer
TIM ROBERTS
VANESSA SUTHERLAND

Executive Vice President, Government Affairs, General Counsel and Corporate Secretary
Executive Vice President, Midstream and Chemicals
27
Cautionary Note Regarding Forward-Looking Statements
This report contains forward-looking statements within the meaning of the federal securities laws. Words such as “adjusted EBITDA,” “anticipated,” “estimated,” “expected,” “planned,” “scheduled,” “targeted,” “believe,” “continue,” “intend,” “will,” “would,” “objective,” “goal,” “project,” “efforts,” “strategies” and similar expressions that convey the prospective nature of events or outcomes generally indicate forwardlooking statements. However, the absence of these words does not mean that a statement is not forward-looking. Forward-looking statements included in this news release are based on management’s expectations, estimates and projections as of the date they are made. These statements are not guarantees of future performance and you should not unduly rely on them as they involve certain risks, uncertainties and assumptions that are difficult to predict. Therefore, actual outcomes and results may differ materially from what is expressed or forecast in such forward-looking statements. Factors that could cause actual results or events to differ materially from those described in the forward-looking statements include: fluctuations in NGL, crude oil, refined petroleum product and natural gas prices, and refining, marketing and petrochemical margins; changes in governmental policies or laws that relate to NGL, crude oil, natural gas, refined petroleum products, or renewable fuels that regulate profits, pricing, or taxation, or other regulations that limit or restrict refining, marketing and midstream operations or restrict exports; the effects of any widespread public health crisis and its negative impact on commercial activity and demand for refined petroleum products; our ability to timely obtain or maintain permits necessary for capital projects; changes to worldwide government policies relating to renewable fuels and greenhouse gas emissions that adversely affect programs including the renewable fuel standards program, low carbon fuel standards and tax credits for biofuels; our ability to achieve the expected benefits of the integration of DCP Midstream, LP (DCP), including the realization of synergies; the success of the company’s business transformation initiatives and the realization of savings and cost reductions from actions taken in connection therewith; unexpected changes in costs for constructing, modifying or operating our facilities; our ability to successfully complete, or any material delay in the completion of, asset dispositions or acquisitions that we may pursue; unexpected difficulties in manufacturing, refining or transporting our products; the level and success of drilling and production volumes around our midstream assets; risks and uncertainties with respect to the actions of actual or potential competitive suppliers and transporters of refined petroleum products, renewable fuels or specialty products; lack of, or disruptions in, adequate and reliable transportation for our NGL, crude oil, natural gas, and refined products; potential liability from litigation or for remedial actions, including removal and reclamation obligations under environmental regulations; failure to complete construction of capital projects on time and within budget; our ability to comply with governmental regulations or make capital expenditures to maintain compliance with laws; limited access to capital or significantly higher cost of capital related to illiquidity or uncertainty in the domestic or international financial markets, which may also impact our ability to repurchase shares and declare and pay dividends; potential disruption of our operations due to accidents, weather events, including as a result of climate change, acts of terrorism or cyberattacks; general domestic and international economic and political developments including armed hostilities (including the Russia-Ukraine war), expropriation of assets, and other political, economic or diplomatic developments; international monetary conditions and exchange controls; changes in estimates or projections used to assess fair value of intangible assets, goodwill and property and equipment and/or strategic decisions with respect to our asset portfolio that cause impairment charges; investments required, or reduced demand for products, as a result of environmental rules and regulations; changes in tax, environmental and other laws and regulations (including alternative energy mandates); political and societal concerns about climate change that could result in changes to our business or increase expenditures, including litigation-related expenses; the operation, financing and distribution decisions of equity affiliates we do not control; and other economic, business, competitive and/or regulatory factors affecting Phillips 66’s businesses generally as set forth in our filings with the Securities and Exchange Commission. Phillips 66 is under no obligation (and expressly disclaims any such obligation) to update or alter its forward-looking statements, whether as a result of new information, future events or otherwise.
Non-GAAP Measures
This report includes the terms “adjusted earnings,” “adjusted earnings per share,” “average adjusted EBITDA,” “controllable costs,” “refining JV controllable costs,” “refining adjusted controllable cost,” “net debt-to-capital ratio,” “net debt-to-capital ratio target,” “adjusted ROCE,” “sustaining capital,” “growth capital,” “adjusted EBITDA” and “mid-cycle adjusted EBITDA.” These are non-GAAP financial measures, some of which as used in certain places in this report, are forward looking non-GAAP financial measures. These non-GAAP financial measures are included to help facilitate comparisons of operating performance across periods and to help facilitate comparisons with other companies in our industry. Where applicable, these measures exclude items that do not reflect the core operating results of our businesses in the current period or other adjustments to reflect how management analyzes results. Reconciliations of these non-GAAP financial measures to, or further discussion of, the most comparable GAAP financial measure are included within this report. Controllable costs are the sum of the operating and selling, general and administrative (SG&A) expense line items on our consolidated statement of income. Joint venture (JV) controllable costs are our share of the operating and SG&A expenses of an equity affiliate, which are reflected as a component of equity in earnings of affiliates on our consolidated statement of income when realized. Refining adjusted controllable cost savings are the sum of operating and SG&A expenses for our Refining segment that are reflected in these line items on our consolidated statement of income when realized, plus our proportional share of operating and SG&A expenses of an operated, unconsolidated refining equity affiliate that are reflected in the equity in earnings of affiliates line item on our consolidated statement of income when realized. Sustaining capital and growth capital are components of total capital expenditures and investments, which is the most directly comparable GAAP financial measure for each component. Net debt to capital
ratio represents the ratio between total debt and total equity, exclusive of total cash, and our net debt to capital ratio target is the ratio we expect to achieve over time. EBITDA is defined as estimated net income plus estimated net interest expense, income taxes, and depreciation and amortization. Adjusted EBITDA is defined as estimated EBITDA plus the proportional share of selected equity affiliates’ estimated net interest expense, income taxes, and depreciation and amortization less the portion of estimated adjusted EBITDA attributable to noncontrolling interests. Net income is the most directly comparable GAAP financial measure for the consolidated company and income before income taxes is the most directly comparable GAAP financial measure for operating segments. Mid-cycle adjusted EBITDA is defined as the targeted average adjusted EBITDA over a complete economic cycle. Forward looking adjusted EBITDA, mid-cycle adjusted EBITDA and projected controllable costs and savings and refining adjusted controllable costs and savings are estimates or targets that depend on future levels of revenues and/or expenses, including amounts that will be attributable to noncontrolling interests or related to equity affiliates, which are not reasonably estimable at this time. Accordingly, we cannot provide a reconciliation of projected adjusted EBITDA or mid-cycle adjusted EBITDA to consolidated net income or segment income before income taxes or projected controllable costs or savings and projected refining adjusted controllable costs or savings to our consolidated or segment operating and SG&A expenses, without unreasonable effort.
References in the report to earnings refer to net income attributable to Phillips 66. References in the report to shareholder distributions or returns to shareholders refer to the sum of dividends paid to Phillips 66 stockholders, amounts paid or accrued to repurchase shares of Phillips 66 common stock and the fair value of shares of Phillips 66 common stock acquired in an exchange transaction. References to run-rate cost savings and run-rate synergies include costs savings and other benefits that will be reflected in the sales and other operating revenues, purchased crude oil and products costs, operating expenses, selling, general and administrative expenses and equity in earnings of affiliates lines on our consolidated statement of income when realized. References to run-rate sustaining capital savings, reductions or efficiencies include savings that will be reflected in the capital expenditures and investments on our consolidated statement of cash flows when realized. References to run-rate savings represent the sum of run-rate cost savings and run-rate sustaining capital savings.
Basis of Presentation
Starting on August 18, 2022, we began consolidating the financial results of DCP Midstream, LP, DCP Sand Hills Pipeline, LLC and DCP Southern Hills Pipeline, LLC. In addition, the financial information included herein for years 2019 and prior reflect changes in the composition of our segments that were reported in our 2022 Form 10-K
Non-GAAP
PRESIDENT AND CEO LETTER STRATEGY FINANCIAL HIGHLIGHTS OPERATING EXCELLENCE LEADERSHIP
Reconciliations RECONCILIATION OF PHILLIPS 66 EARNINGS TO ADJUSTED EARNINGS (Millions of Dollars Except as Indicated) 2023 2022 2021 Consolidated Earnings $7,015 11,024 1,317 Pre-tax adjustments: Impairments 1,496 Certain tax impacts (19) (11) Pension settlement expense 77 Hurricane-related costs (recovery) — (21) 45 Winter-storm-related costs — — 51 Net gain on asset disposition (123) — — Alliance shutdown-related costs — 26 192 Regulatory compliance costs — 70 (88) Legal accrual 30 — Business transformation restructuring costs 177 159 Loss on early redemption of DCP debt 53 — Merger transaction costs — 13 Gain on consolidation — (3,013) Change in inventory method for acquired business (46) — DCP integration restructuring costs 38 18 Tax impact of adjustments1 (26) 635 (420) Other tax impacts 83 — (85) Noncontrolling interests (19) (10) (53) Adjusted earnings $7,163 8,901 2,521 Earnings per share of common stock (dollars) $15.48 23.27 2.97 Adjusted earnings per share of common stock (dollars)2 $15.81 18.79 5.70 APPENDIX 28 PHILLIPS 66 2023 YEAR IN REVIEW
1 We generally tax effect taxable U.S.-based special items using a combined federal and state statutory income tax rate of approximately 24%. Taxable special items attributable to foreign locations likewise use a local statutory income tax rate. Nontaxable events reflect zero income tax. These events include, but are not limited to, most goodwill impairments, transactions legislatively exempt from income tax, transactions related to entities for which we have made an assertion that the undistributed earnings are permanently reinvested, or transactions occurring in jurisdictions with a valuation allowance.
2 2022 and 2021 are based on adjusted weighted-average diluted shares of 473,728 thousand and 441,418 thousand, respectively. Other periods are based on the same weighted-average diluted shares outstanding as that used in the GAAP diluted earnings per share calculation. Income allocated to participating securities, if applicable, in the adjusted earnings per share calculation is the same as that used in the GAAP diluted earnings per share calculation.
RECONCILIATION OF PHILLIPS 66 ROCE TO ADJUSTED ROCE (Millions of Dollars Except as Indicated) Numerator 2023 2022 2021 Average 2012-2023 Net income $7,239 11,391 1,594 4,134 After-tax interest expense 709 489 459 336 ROCE earnings $7,948 11,880 2,053 4,470 After-tax special items 167 (2,113) 1,257 59 Adjusted ROCE earnings $8,115 9,767 3,310 4,529 Denominator Average capital employed1 $51,153 43,691 36,751 35,886 Discontinued operations (24) Adjusted average capital employed $51,153 43,691 36,751 35,862 ROCE 16% 27% 6% 13% Adjusted ROCE 16% 22% 9% 13% 1 Capital employed is total equity plus total debt. RECONCILIATION OF PHILLIPS 66 DEBT-TO-CAPITAL RATIO TO NET DEBT-TO-CAPITAL RATIO (Millions of Dollars Except as Indicated) 2023 2022 2021 Total Debt $19,359 17,190 14,448 Total Equity 31,650 34,106 21,637 Debt-to-Capital Ratio 38% 34% 40% Total Cash $3,323 6,133 3,147 Net Debt-to-Capital Ratio 34% 24% 34% RECONCILIATION OF PHILLIPS 66 NET INCOME TO ADJUSTED EBITDA (Millions of Dollars) 2017 2018 2019 Net Income $5,248 5,873 3,377 Plus: Income tax expense (benefit) (1,693) 1,572 801 Net interest expense 407 459 415 Depreciation and amortization 1,318 1,356 1,341 Phillips 66 EBITDA 5,280 9,260 5,934 Special Item Adjustments (pre-tax): Impairments by equity affiliates 64 28 47 Pending claims and settlements (57) 21 (21) Certain tax impacts (23) (119) (90) Gain on consolidation of business (423) — Net gain on asset dispositions — — (17) Impairments — 853 Lower-of-cost-or-market inventory adjustments — 65 Pension settlement expense 83 67 — Hurricane-related costs 210 — U.S. tax reform (16) Total Special Item Adjustments (pre-tax) (146) (19) 837 Phillips 66 EBITDA, Adjusted for Special Items $5,134 9,241 6,771 Other Adjustments (pre-tax): Proportional share of selected equity affiliates income taxes 105 128 114 Proportional share of selected equity affiliates net interest 128 171 182 Proportional share of selected equity affiliates depreciation and amortization 624 781 799 Adjusted EBITDA attributable to public ownership interest in PSXP (238) (369) (413) Phillips 66 Adjusted EBITDA $5,753 9,952 7,453 2017 - 2019 Average Adjusted EBITDA $7,719 PHILLIPS 66 CAPITAL EXPENDITURES AND INVESTMENTS (Millions of Dollars) 2023 2022 2021 Growth $1,567 1,276 928 Sustaining 851 918 932 Total Adjusted Capital Spending $2,418 2,194 1,860 PHILLIPS 66 CAPITAL EXPENDITURES AND INVESTMENTS 2024 BUDGET (Millions of Dollars) Growth Sustaining Total Midstream1 $593 392 985 Refining 654 412 1,066 Marketing and Specialties 61 51 112 Corporate and Other — 68 68 Phillips 66 Consolidated $1,308 923 2,231 1 Midstream growth capital includes $250 million related to our 25% share of a joint venture’s debt repayment due in 2024. RECONCILIATION OF CORPORATE & OTHER LOSS BEFORE INCOME TAXES TO ADJUSTED EBITDA (Millions of Dollars) 2017 2018 2019 Loss before income taxes $(895) (853) (804) Plus: Net interest expense 408 459 415 Depreciation and amortization 86 82 80 Corporate & Other EBITDA $(401) (312) (309) Special Item Adjustments (pre-tax): Pending claims and settlements 31 — Pension settlement expense 7 6 — U.S. tax reform — (16) — Total Special Item Adjustments (pre-tax) 38 (10) — Coporate & Other EBITDA, Adjusted for Special Item $(363) (322) (309) Other Adjustments (pre-tax): None — — — Corporate & Other Adjusted EBITDA $(363) (322) (309) 2017 - 2019 Average Adjusted EBITDA $(331) 29
RECONCILIATION OF MIDSTREAM INCOME BEFORE INCOME TAXES TO ADJUSTED EBITDA (Millions of Dollars) 2017 2018 2019 Income before income taxes $615 1,088 597 Plus: Interest Revenue (1) — Depreciation and amortization 298 310 291 Midstream EBITDA $912 1,398 888 Special Item Adjustments (pre-tax): Impairments by equity affiliates — 28 47 Pending claims and settlements (37) 21 — Impairments — 853 Pension settlement expense 12 9 Hurricane-related costs 10 Total Special Item Adjustments (pre-tax) (15) 58 900 Midstream EBITDA, Adjusted for Special Items $897 1,456 1,788 Other Adjustments (pre-tax): Proportional share of selected equity affiliates income taxes 15 4 12 Proportional share of selected equity affiliates net interest 125 133 138 Proportional share of selected equity affiliates depreciation and amortization 189 216 237 Midstream Adjusted EBITDA $1,226 1,809 2,175 2017 - 2019 Average Adjusted EBITDA $1,737 RECONCILIATION OF REFINING INCOME BEFORE INCOME TAXES TO ADJUSTED EBITDA (Millions of Dollars) 2017 2018 2019 Income before income taxes $2,076 4,628 2,132 Plus: Depreciation and amortization 823 849 867 Refining EBITDA $2,899 5,477 2,999 Special Item Adjustments (pre-tax): Pending claims and settlements (51) — (21) Certain tax impacts (23) (6) — Gain on consolidation of business (423) — — Asset dispositions — — (17) Pension settlement expense 53 43 — Hurricane-related costs 24 — — Total Special Item Adjustments (pre-tax) (420) 37 (38) Refining EBITDA, Adjusted for Special Items $2,479 5,514 2,961 Other Adjustments (pre-tax): Proportional share of selected equity affiliates income taxes 1 1 — Proportional share of selected equity affiliates net interest (3) (6) (3) Proportional share of selected equity affiliates depreciation and amortization 82 94 97 Refining Adjusted EBITDA $2,559 5,603 3,055 2017 - 2019 Average Adjusted EBITDA $3,739 RECONCILIATION OF MARKETING & SPECIALTIES INCOME BEFORE INCOME TAXES TO ADJUSTED EBITDA (Millions of Dollars) 2017 2018 2019 Income before income taxes $1,020 1,556 1,374 Plus: Depreciation and amortization 112 114 103 Marketing & Specialties EBITDA $1,132 1,670 1,477 Special Item Adjustments (pre-tax): Certain tax impacts — (113) (90) Pension settlement expense 11 9 — Hurricane-related costs 1 — — Total Special Item Adjustments (pre-tax) 12 (104) (90) Marketing & Specialties EBITDA, Adjusted for Special Items $1,144 1,566 1,387 Other Adjustments (pre-tax): Proportional share of selected equity affiliates income taxes 21 23 23 Proportional share of selected equity affiliates net interest 2 6 7 Proportional share of selected equity affiliates depreciation and amortization 36 39 40 Marketing & Specialties Adjusted EBITDA $1,203 1,634 1,457 2017 - 2019 Average Adjusted EBITDA $1,431 RECONCILIATION OF CHEMICALS INCOME BEFORE INCOME TAXES TO ADJUSTED EBITDA (Millions of Dollars) 2017 2018 2019 Income before income taxes $716 1,025 879 Plus: None — — Chemicals EBITDA $716 1,025 879 Special Item Adjustments (pre-tax): Impairments by equity affiliates 64 — — Lower-of-cost-or-market inventory adjustments — 65 Hurricane-related costs 175 — — Total Special Item Adjustments (pre-tax) 239 — 65 Chemicals EBITDA, Adjusted for Special Items $955 1,025 944 Other Adjustments (pre-tax): Proportional share of selected equity affiliates income taxes 68 100 79 Proportional share of selected equity affiliates net interest 4 38 40 Proportional share of selected equity affiliates depreciation and amortization 317 432 425 Chemicals Adjusted EBITDA $1,344 1,595 1,488 2017 - 2019 Average Adjusted EBITDA $1,476 APPENDIX PRESIDENT AND CEO LETTER STRATEGY FINANCIAL HIGHLIGHTS OPERATING EXCELLENCE LEADERSHIP 30 PHILLIPS 66 2023 YEAR IN REVIEW
Shareholder Information
Direct Stock Purchase and Dividend Reinvestment Plan
Phillips 66’s Investor Services Program is a direct stock purchase and dividend reinvestment plan that offers shareholders a convenient way to buy additional shares and reinvest their common stock dividends. Purchases of company stock through direct cash payment are commission-free.
Please call Computershare to request an enrollment package:
Toll-free number: 866-437-0009
Or enroll online at www.computershare.com/investor
Registered shareholders can access important investor communications online and sign up to receive future shareholder materials electronically by going to www.computershare.com/investor and following the enrollment instructions.
Principal and Registered Offices
Phillips 66
P.O. Box 421959
Houston, TX 77242-1959
251 Little Falls Drive Wilmington, DE 19808
Stock Transfer Agent and Registrar
Computershare
150 Royall Street Canton, MA 02021
www.computershare.com/investor
Information Requests
For information about dividends and certificates or to request a change of address form, shareholders may contact:
Computershare
P.O. Box 43006
Providence, RI 02940-3006
Toll-free number: 866-437-0009
Outside the U.S.: 201-680-6578
TDD for hearing impaired: 800-231-5469
TDD outside the U.S.: 201-680-6610 www.computershare.com/investor
Personnel in the following offices also can answer investors’ questions about the company:
Institutional Investors
800-624-6440
investorrelations@p66.com
Individual Investors
866-437-0009
web.queries@computershare.com
Compliance and Ethics
For guidance, to express concerns or to ask questions about compliance and ethics issues, contact the
Phillips 66 Corporate Ethics Office:
Attn: Corporate Ethics Office
Phillips 66
2331 CityWest Blvd.
Houston, TX 77042
Toll-free number available 24/7: 855-318-5390
ethics@p66.com
www.phillips66.ethicspoint.com
Internet
www.phillips66.com
The website includes resources of interest to investors, including news releases and presentations to securities analysts; copies of the Phillips 66 Proxy Statement; reports to the U.S. Securities and Exchange Commission; and data on health, safety and environmental performance.
www.cpchem.com
The website provides information on topics included in this report.
Disclosure Statements
“Phillips 66,” “the company,” “we,” “us” and “our”are used interchangeably in this report to refer to the businesses of Phillips 66 and its consolidated subsidiaries.
Phillips 66®, Conoco®, 76®, Kendall®, Red Line®, JET® and their respective logos are registered trademarks of Phillips 66 Company or a wholly owned subsidiary. Other names and logos mentioned herein are the trademarks of their respective owners.
24-0019_1 2024 © Phillips 66 Company. All rights reserved. 31

@PHILLIPS66CO
